Author name: Mr. Sushil Alewa

Sushil Alewa is the Founder & Director of ISFM – International School of Financial Market, established in July 2014 with the aim of bridging the gap between academic finance and real, practical market participation. A Certified Financial Planner - CFP from US (Reg. No. IN 51734) and SEBI Registered Research Analyst (Reg. No. INH100009433) with an MBA in finance, Sushil has spent more than 16 years in the Indian capital markets. His career spans equity advisory and research at Sharekhan, India Infoline, Indiabulls and Religare, followed by HNI portfolio advisory at Anand Rathi Wealth Management — experience that shaped the practitioner-first approach ISFM is known for today. He is an active trader and researcher, and his teaching draws directly from live market work rather than theory alone. His areas of focus include technical analysis, derivatives and options strategies, equity research and fundamental analysis, and investor awareness. Sushil is currently a PhD scholar researching options trading strategies, and regularly conducts investor awareness and financial literacy programs for students, professionals and corporate audiences.

Technical analysis vs fundamental analysis
Blog

Technical Analysis vs Fundamental Analysis: Key Differences, Pros & Profit Strategies

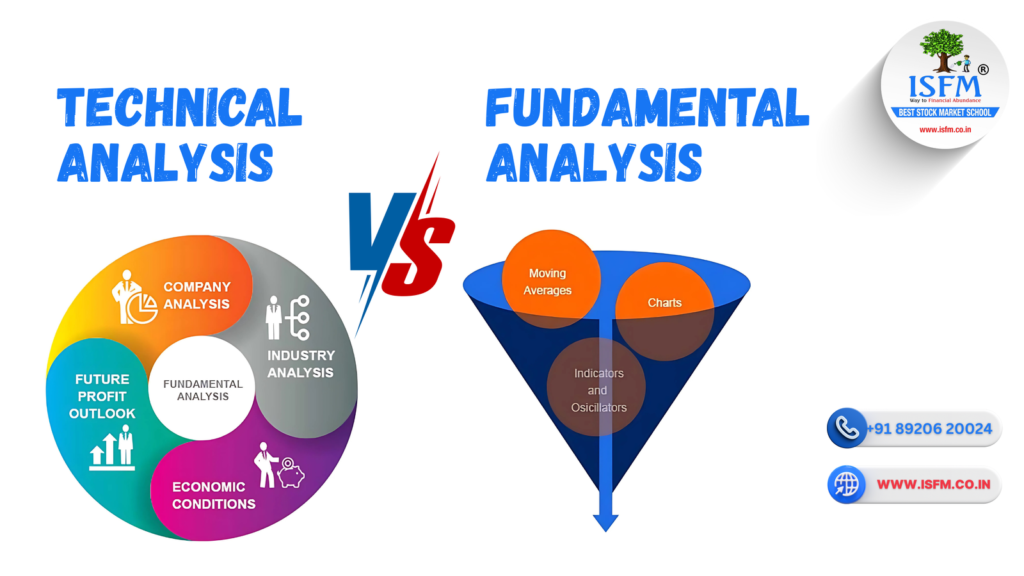
In the ever-evolving world of trading and investing, understanding market movements is essential for success. Two primary analytical methods dominate this space—technical analysis and fundamental analysis. While both aim to forecast future price movements and enhance profitability, their methodologies differ greatly. In this guide, we’ll break down the core principles, benefits, limitations, and effective strategies of both approaches to help you make smarter financial decisions. What is Technical Analysis? Technical analysis is the study of past price movements and market behavior to predict future trends, using charts, indicators, and patterns. Key Components: Advantages: Limitations: Want to dive deeper? Explore our beginner-friendly technical analysis course at ISFM. What is Fundamental Analysis? Fundamental analysis evaluates a company’s financial health, economic environment, and industry positioning to determine its intrinsic value. Core Elements: Advantages: Limitations: Looking to invest long-term? Check out our guide on value investing in Indian stocks. Profit Strategies Using Technical Analysis Learn how to master price action trading strategies in our stock market blog. Also Read: Top 5 Paper Trading Apps in India (2025): Practice, Learn & Excel Without Risk Profit Strategies Using Fundamental Analysis Can You Combine Both? Absolutely! A hybrid investing model offers the best of both worlds: Conclusion Whether you’re an active trader or a long-term investor, understanding the strengths and weaknesses of both technical and fundamental analysis is crucial. While technical tools help time the market, fundamental research helps understand what to invest in. Smart investors often blend both for better risk-adjusted returns. By learning and applying these approaches, you can confidently navigate different market conditions and build a strategy that suits your goals.


what is ipo
Uncategorized

Understanding IPOs: Meaning, Benefits, Risks & Profit Strategies for Investors

An Initial Public Offering (IPO) is a milestone event for any private company going public. It not only opens up new avenues for capital but also offers retail and institutional investors a shot at wealth creation. In this guide, we’ll break down what an IPO really is, why it matters, how to analyze one, and the best ways to profit from IPOs while managing risks. Why is an IPO? An IPO, or Initial Public Offering, is when a privately held company offers its shares to the public for the first time. It involves working with investment banks to meet regulatory guidelines, determine a share price, and list on a stock exchange like the NSE or BSE. This process allows the company to raise capital from retail and institutional investors, fueling its next growth phase. Why Are IPOs Important? 1. For Companies 2. For the Economy Pros and Cons of IPOs 1. For Companies Pros Cons 2. For Investors Pros Cons How to Analyze an IPO? To make informed investment decisions, consider these factors: How to Profit from IPOs: Key Strategies Investor Tips Before Investing in IPOs Conclusion IPOs offer exciting investment opportunities but aren’t free from risk. A disciplined approach to IPO analysis, coupled with realistic expectations and diversified investments, can help you benefit from this dynamic space. Whether you’re aiming for listing-day profits or long-term gains, always let research—not hype—guide your decisions. For deeper insights on stock market investing, check out our Stock Market Courses at ISFM.

Top 5 paper trading app in India
Blog

Top 5 Paper Trading Apps in India (2025): Practice, Learn & Excel Without Risk

Diving into stock trading without adequate experience can be risky. That’s where paper trading apps come in—they allow you to simulate real-time trades using virtual money. Whether you’re a beginner or refining strategies as a seasoned trader, paper trading helps you learn the ropes without financial risk. In India, several platforms offer robust paper trading features tailored for different trading styles. In this article, we’ll walk you through the top 5 paper trading apps in India, their unique features, advantages, limitations, and how they help you become a more confident and skilled trader. 1. Zerodha Streak – Best for Algorithmic Strategy Simulation Key Highlights: Pros: Cons: Why Use It?Streak allows aspiring traders to automate and test trading strategies without risking real money—perfect for those wanting to step into the world of algorithmic trading in India. 2. Upstox Pro (Paper Trading) – Best for Real-Time Technical Practice Key Highlights: Pros: Cons: Upstox Pro is ideal for practicing intraday strategies, placing virtual orders, and understanding technical indicators before going live. 3. TradingView Paper Trading – Best for Chart Analysis and Global Markets Key Highlights: Pros: Cons: TradingView is unmatched for traders who focus on technical charting, price action, and want exposure to international markets. 4. Angel One ARQ Prime – Best for Long-Term Investment Practice Key Highlights: Pros: Cons: ARQ is built for investors wanting to test investment strategies and understand portfolio diversification using AI-generated insights. 5. Zerodha Varsity – Best for Learning + Simulated Practice Key Highlights: Pros: Cons: Zerodha Varsity is perfect for beginner traders who want to build a solid theoretical foundation before jumping into live or paper trading. Why Use a Paper Trading App? Using paper trading platforms provides immense benefits, such as: FAQs About Paper Trading in India Q1: Are paper trading apps free to use in India?Yes, most apps like Zerodha Streak, Angel One ARQ, and Zerodha Varsity are completely free. Others like Upstox Pro offer limited-time free trials. Q2: Can I practice options trading on these apps?Yes. Platforms like Zerodha Streak and Upstox Pro support paper trading for F&O (Futures & Options). Q3: Do these apps offer real-time market data?Apps such as Streak, TradingView, and Upstox Pro provide access to live or near real-time data for an authentic experience. Conclusion Whether you’re a beginner taking baby steps into the stock market or an expert testing new strategies, paper trading apps in India are the perfect bridge to successful live trading. Choose the one that aligns with your style—be it algorithmic, technical, or investment-focused—and start your journey today with zero risk.

B-61 top 5 virtual trading app in India
Blog

Top 5 Virtual Trading Apps in India: Features, Benefits & Why Every Trader Should Use Them

In the evolving landscape of stock markets, virtual trading apps in India have become essential tools for anyone looking to enter or excel in the trading world. Whether you’re a beginner eager to learn or an expert refining strategies, these paper trading platforms offer a risk-free environment to test your skills using real-time or historical data. Here’s a detailed look at the top 5 virtual trading apps in India, including their features, benefits, and how they contribute to a trader’s journey. 1. Zerodha Varsity Key Features: Why It Matters: Zerodha Varsity is perfect for foundational learning. It simplifies complex market concepts like technical analysis and risk management, making it ideal for beginners. How It Helps Traders: 2. Upstox ProStocks Simulator Key Features: Why It Matters: Upstox’s simulator replicates a genuine trading environment, helping users practice trade execution and platform navigation in real conditions. How It Helps Traders: 3. Angel One Smart Money Key Features: Why It Matters: This app helps traders replay and learn from past market scenarios, enhancing their strategic thinking and analytical skills. How It Helps Traders: 4. Groww Stock Simulator Key Features: Why It Matters: Groww’s simulator emphasizes long-term investing and financial planning, making it perfect for users interested in SIPs, mutual funds, and wealth creation. How It Helps Traders: 5. 5paisa Paper Trading Platform Key Features: Also Read:Short Covering in the Stock Market: A Comprehensive Guide to Trading Opportunities & Risks Why It Matters: 5paisa’s gamified trading environment motivates users through leaderboards, making learning competitive and engaging. How It Helps Traders: Why Virtual Trading Apps Are Essential? Whether you’re a novice or a full-time trader, here’s why using virtual stock market simulators makes sense: How to Pick the Best Virtual Trading App for You? User Type Recommended App Complete Beginners Zerodha Varsity, Groww Intermediate/Active Traders Upstox, Angel One Gamified Learning Lovers 5paisa Choose the platform that best suits your learning style, goals, and market interest. Final Thoughts Virtual trading apps aren’t just for practice—they’re a stepping stone to real market success. By simulating trades, analyzing performance, and adapting to market behaviors, you build a solid foundation for live trading. Whether you’re learning to invest or sharpening your day trading strategies, these apps can make a meaningful difference. So, pick a platform, dive into paper trading, and start building your trading confidence today! 🚀

B-553 What is short covering in stock market
Blog

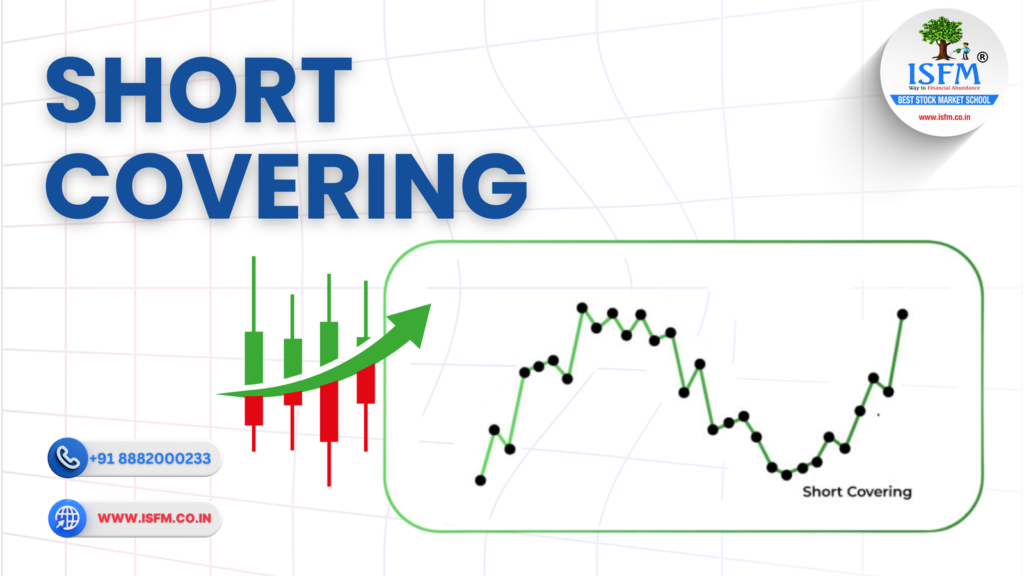
Short Covering in the Stock Market: A Comprehensive Guide to Trading Opportunities & Risks

Short covering refers to the act of buying back previously short-sold shares to close an open position. Traders initiate this move to lock in profits or minimize losses when the stock price moves against their expectations. For beginners: Short selling involves borrowing shares to sell at a high price, hoping to repurchase them later at a lower rate. Why Do Traders Engage in Short Covering? Understanding the triggers behind short covering can give traders a serious edge. Here are the most common reasons: Advantages & Disadvantages of Short Covering Pros Cons How to Profit from Short Covering: Proven Strategies 1. Spot a Potential Short Squeeze Early 2. Use Technical Indicators 3. Deploy Options Strategies 4. Monitor Sentiment & Social Media Buzz Risks Traders Must Consider Case Study: GameStop (GME) – The Ultimate Short Squeeze In early 2021, GameStop (GME) surged over 1,500% as retail traders from Reddit orchestrated a historic short squeeze. Hedge funds incurred massive losses, while early buyers reaped significant profits. This event highlighted the power of collective retail sentiment in markets. Frequently Asked Questions (FAQs) Q1: What does short interest mean?A: Short interest = Total shares sold short ÷ Total shares available (float). High ratios signal potential for squeezes. Q2: Can short covering lead to long-term gains?A: It can spark momentum, but without fundamental support, prices often normalize quickly. Q3: Is short covering illegal?A: No. It’s a legal trading action. However, manipulating prices to force short covering can breach market regulations. Conclusion: Mastering Short Covering for Smart Trading Short covering presents both risk and reward. For savvy traders, it’s an opportunity to ride momentum waves and profit from volatility. But like any market strategy, it demands discipline, timing, and risk management. Use technical indicators, track market sentiment, and combine fundamental analysis to make informed trading decisions.

B-551 What is Short Buildup in options trading
Blog

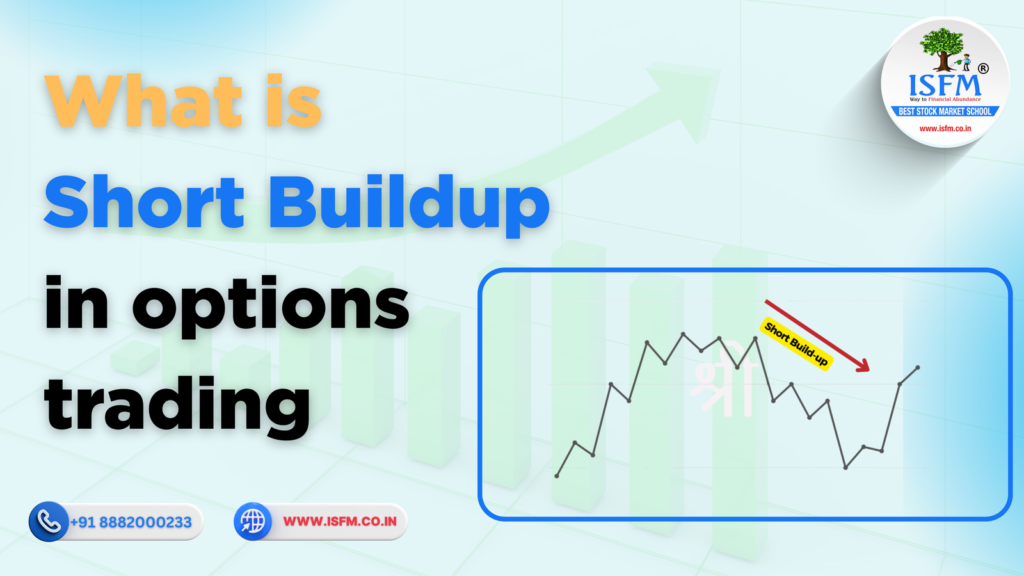
Understanding Short Buildup in Options Trading: Analysis, Strategies & Profit Opportunities

In the dynamic world of options trading, identifying market sentiment is crucial for success. One such powerful indicator is short buildup, which can signal a bearish outlook among traders. This comprehensive guide explains the concept of short buildup, how to analyze it effectively, strategic approaches to leverage it, and how to manage risk for optimal results. What is Short Buildup in Options Trading? Short buildup refers to a scenario where there’s an increase in open interest (number of active contracts) while the underlying asset’s price declines. This pattern suggests that traders expect the price to continue falling and are positioning themselves accordingly. Common strategies during a short buildup include: While both reflect bearish sentiment, short calls involve unlimited risk, while long puts cap risk at the premium paid. How to Identify a Short Buildup To effectively analyze short buildup in the market: 1. Track Open Interest & Price Action 2. Volume Confirmation 3. Check Put-Call Ratio (PCR) 4. Use Technical Indicators Advantages & Disadvantages of Short Buildup Trades Pros Cons How to Trade and Profit from a Short Buildup Here are common strategies traders use to benefit from short buildup scenarios: 🔹 Buy Put Options 🔹 Sell Call Options 🔹 Use Spread Strategies 🔹 Pair with Technical Breakdowns 🔹 Risk Management Essentials Real-World Example of Short Buildup Let’s say Stock XYZ drops from ₹100 to ₹90. Meanwhile, open interest for ₹95 puts increases significantly. This suggests traders are anticipating further downside. Similarly, a spike in short calls at ₹105 implies a belief that the stock won’t cross that level soon. Also Read: Top 5 Flat Candlestick Trading Patterns Conclusion Short buildup is a vital indicator for traders looking to identify bearish momentum in the options market. By understanding how to read open interest, price trends, and volume, you can spot opportunities to profit in falling markets or safeguard your portfolio through effective hedging. Combine this analysis with proper technical indicators and sound risk management to improve your trading outcomes.

Best Stock Market Courses in India for 2025 – Online & Offline Option
Blog

Top 5 Stock Market Courses in India (2025): A Comparative Guide for Aspiring Traders & Investors

The Indian stock market is growing rapidly, attracting thousands of new investors and job-seekers every day. With this boom, there’s a rising demand for quality stock market courses that offer practical skills, certifications, and placement opportunities. If you’re looking to learn trading, technical analysis, options, or build a career in BFSI, this blog will guide you through the Top 5 Stock Market Courses in India—and why CSTX by ISFM stands out as the #1 choice. What Makes a Great Stock Market Course? Before we jump into the list, here are key things to look for in any stock market course: Now, let’s explore the top courses. 1. CSTX – Chartered Stock Trading Expert by ISFM Offered by: ISFM (International School of Financial Market) – India’s Best Stock Market School Why CSTX is #1: The CSTX course is a complete, beginner-to-expert stock market program that combines practical live training, professional mentorship, and NISM exam preparation under one roof. Key Highlights: 👉 Explore CSTX Course in Detail📍 Gurgaon | 📱 +91 8882000233 2. NIFM – Diploma in Financial Market Management Offered by: National Institute of Financial Markets Strengths: Limitations: Fee: ₹45,000 – ₹60,000Website: nifm.in 3. The Wall Street School – Financial Modeling & Valuation + Trading Courses Offered by: The Wall Street School (Delhi NCR) Strengths: Limitations: Fee: ₹75,000 – ₹90,000Website:thewallstreetschool.com 4. IFMC – Stock Market Course for Beginners Offered by: IFMC Institute Strengths: Limitations: Fee: ₹25,000 – ₹40,000Website: ifmcinstitute.com 5. FinGrad – Online Trading Courses Offered by: FinGrad by Elearnmarkets Strengths: Limitations: Fee: ₹1,500 – ₹15,000 per moduleWebsite: joinfingrad.in Comparison Table: Top 5 Stock Market Courses in India Feature ISFM – CSTX NIFM Wall Street School IFMC FinGrad Live Trading Exposure ✅ Yes ✅ ❌ Limited ❌ ❌ NISM/SEBI Certification ✅ Included ✅ ✅ ✅ ✅ One-to-One Mentorship ✅ Yes ❌ ❌ ❌ ❌ Free Tools & Software ✅ Yes ❌ ❌ ❌ ❌ Placement Assistance ✅ 100% Support ✅ ❌ ❌ ❌ Mode Online + Offline Both Offline Both Online Fee Range ₹45K–₹50K ₹45K–₹60K ₹75K+ ₹25K+ ₹1.5K+ Conclusion: Why ISFM’s CSTX is India’s Best Stock Market Course in 2025 When it comes to hands-on trading, NISM preparation, mentorship, and career support, no other institute matches what ISFM (International School of Financial Market) offers. Whether you’re a 12th pass beginner, working professional, housewife, or investor, CSTX gives you everything you need to become a stock market expert—and earn a second income or full-time financial career. 🎯 Ready to Learn & Earn from the Market?👉 Join the CSTX Course Today📞 Call: +91 8882000233 | +91 8168573253📍 Location: Sector-38, Medicity Road, Gurgaon🌐 Website: www.isfm.co.in

top 5 Flat candlestick pattern
Blog

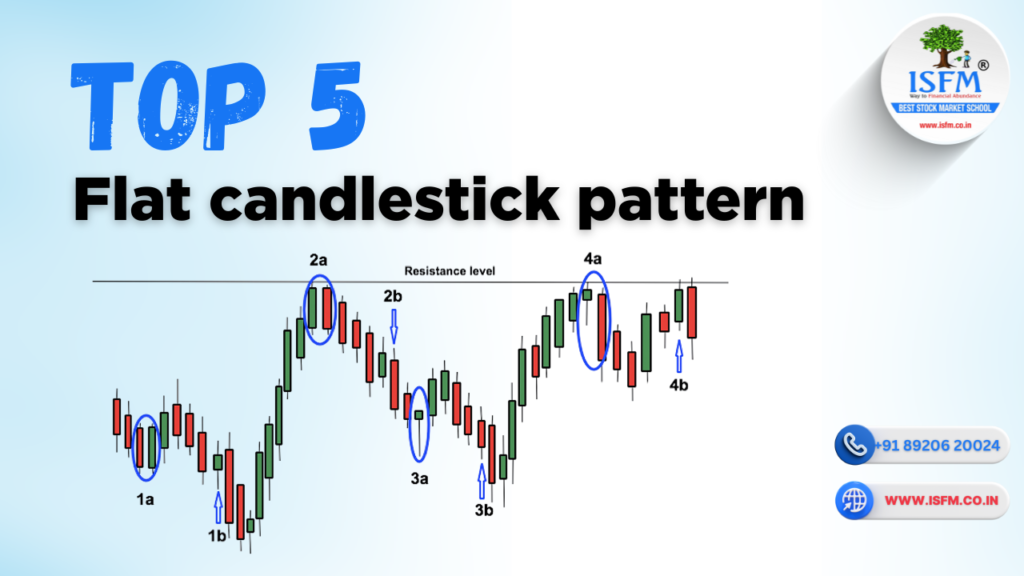
Top 5 Flat Candlestick Trading Patterns: Read the Market’s Pause Like a Pro

In technical analysis, not every candlestick signals a clear direction. Some candles represent indecision, exhaustion, or balance between buyers and sellers. These are known as Flat Candlestick Patterns—neutral setups that often appear before major breakouts or reversals. In this blog, we will uncover the Top 5 Flat Candlestick Trading Patterns, their trading significance, and how to use them effectively. We’ll cover: 1. Doji Candlestick What Is It? The Doji has an almost equal open and close, forming a cross-like shape. It indicates indecision in the market. Relevance: Confirmation: Failure Signs: Stop Loss: Special Tips: 2. Spinning Top What Is It? A small-bodied candle with long upper and lower wicks, signaling market indecision or pause in momentum. Relevance: Confirmation: Failure Signs: Stop Loss: Special Tips: 3. Long-Legged Doji What Is It? A variation of the Doji with very long upper and lower shadows, reflecting extreme indecision or volatility. Relevance: Confirmation: Failure Signs: Stop Loss: Special Tips: 4. Inside Bar (Flat Formation) 🔍 What Is It? An Inside Bar is when the entire candle is contained within the range of the previous candle—indicating consolidation or pause. Relevance: Confirmation: Failure Signs: Stop Loss: Special Tips: 5. Four-Price Doji 🔍 What Is It? A rare pattern where open, close, high, and low are all the same or nearly identical. It appears as a single flat line on the chart. Relevance: Confirmation: Failure Signs: Stop Loss: Special Tips: Learn Flat & Reversal Patterns at ISFM At ISFM – International School of Financial Market, we help students and traders: 📚 Our Most Popular Courses: 🎓 Technical Analysis Course – Online & Offline🎓 Chartered Stock Trading Expert – CSTX🎓 Stock Market Trading Courses (Beginner to Pro) ✅ SEBI/NISM Certification Training✅ One-on-One Mentorship✅ 100% Placement Assistance✅ Weekend & Online Batches Available 📞 Call Now: +91 8882000233 | +91 8168573253📍 ISFM, Sector-38, Medicity Road, Gurgaon🌐 Visit: www.isfm.co.in Conclusion Flat candlestick patterns may not be dramatic—but they are powerful signs of what’s coming next. By learning how to identify and confirm these setups, you’ll be better equipped to anticipate breakouts, avoid traps, and trade smarter.

Top-5-NISM-Certifications
Blog

Top 5 NISM Certifications for Beginners: Start Your Financial Market Career Today

If you’re looking to build a successful career in the stock market, mutual funds, or investment advisory, getting certified by NISM (National Institute of Securities Markets) is the best starting point. NISM certifications are SEBI-mandated and highly valued in the financial services industry. Whether you’re a student, fresher, or working professional, these certifications can help you enter the BFSI sector confidently. In this blog, we’ll cover: 1. NISM Series V-A: Mutual Fund Distributor Certification Why It’s Important: Career Scope: Where to Learn: ✅ Mutual Fund Training Course at ISFMIncludes: NISM exam preparation + practical training 2. NISM Series VIII: Equity Derivatives Certification Why It’s Important: Career Scope: Where to Learn: ✅ Advanced Derivatives Training CourseIncludes: Option Greeks, PCR, OI Analysis + NISM prep 3. NISM Series VA: Investment Advisor Level 1 Why It’s Important: Career Scope: Where to Learn: ✅ Certified Financial Planning CourseIncludes: NISM Level 1 modules + case studies + live projects 4. NISM Series I: Currency Derivatives Certification Why It’s Important: Career Scope: Where to Learn: ✅ Currency Derivatives Training Course 5. NISM Series II-A: Registrar and Transfer Agent – Mutual Fund Certification Why It’s Important: Career Scope: Where to Learn: ✅ Diploma in Banking & FinanceIncludes NISM compliance training and placement support Why Choose ISFM for NISM Certification Coaching? At ISFM – International School of Financial Market, we don’t just help you pass NISM exams—we help you build a real career in the financial industry. What You’ll Get: 📍 Location: Sector-38, Gurgaon (Near Medanta Hospital)📞 Call: +91 8882000233 | +91 8168573253🌐 Website: www.isfm.co.in Conclusion If you’re serious about starting a career in finance or stock markets, NISM certifications are your gateway. They are affordable, SEBI-recognized, and open up job roles in broking firms, fund houses, and advisory companies.

top 5 bearish candlestick pattern
Uncategorized

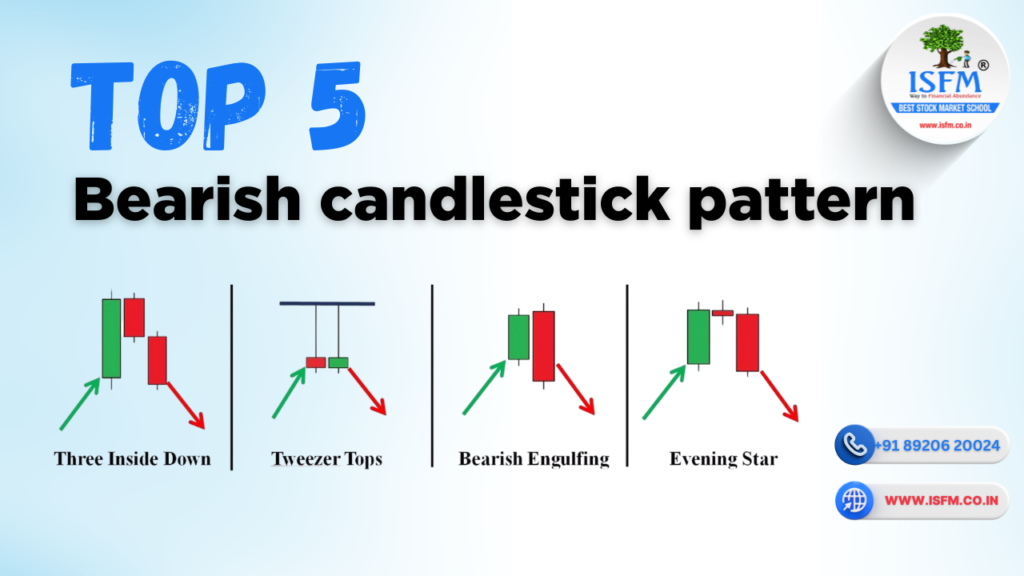
Top 5 Bearish Candlestick Trading Patterns Every Trader Must Master

When the market signals weakness, you need to be prepared. Knowing how to identify bearish candlestick patterns can help you protect profits, avoid traps, and even capitalize on trend reversals. In this blog, we’ll break down the Top 5 Bearish Candlestick Patterns that signal potential downturns, and cover: 1. Bearish Engulfing Pattern What Is It? A two-candle reversal pattern where the second candle (red) completely engulfs the body of the first candle (green). It forms after an uptrend and signals strong selling pressure. Relevance: Confirmation: Failure Signs: Stop Loss: Special Point: 2. Evening Star Pattern What Is It? A three-candle reversal pattern: Relevance: Confirmation: Failure Signs: Stop Loss: Special Point: 3. Shooting Star Pattern What Is It? A single bearish reversal candle with a small real body near the low and a long upper wick, appearing at the top of an uptrend. Relevance: Confirmation: Failure Signs: Stop Loss: Special Point: 4. Dark Cloud Cover What Is It? A two-candle bearish reversal pattern where: Relevance: Confirmation: Failure Signs: Stop Loss: Special Point: 5. Hanging Man Pattern What Is It? A single-candle pattern with a small real body at the top and a long lower shadow, formed after an uptrend. Relevance: Confirmation: Failure Signs: Stop Loss: Special Point: Learn Reversal Patterns with ISFM At ISFM – International School of Financial Market, we teach how to use bearish candlestick patterns strategicallywith confluence tools like: Our Top Courses Include: 📘 Technical Analysis Course – Online & Offline📘 CSTX – Chartered Stock Trading Expert Course📘 Stock Trading Courses for Beginners & Traders ✅ Live Market Practice✅ Free Study Material + Backup Videos✅ SEBI/NISM Certification Prep✅ 100% Placement Assistance 📞 Call Now: +91 8882000233 | +91 8168573253📍 ISFM, Sector-38, Gurgaon🌐 Visit:www.isfm.co.in Conclusion These Top 5 Bearish Candlestick Patterns can help you protect your capital, spot reversals early, and even profit from market corrections. Whether you’re a beginner or active trader, learning to use these patterns with confirmation and risk control will take your trading game to the next level.

Scroll to Top