Author name: Mr. Sushil Alewa

Sushil Alewa is the Founder & Director of ISFM – International School of Financial Market, established in July 2014 with the aim of bridging the gap between academic finance and real, practical market participation. A Certified Financial Planner - CFP from US (Reg. No. IN 51734) and SEBI Registered Research Analyst (Reg. No. INH100009433) with an MBA in finance, Sushil has spent more than 16 years in the Indian capital markets. His career spans equity advisory and research at Sharekhan, India Infoline, Indiabulls and Religare, followed by HNI portfolio advisory at Anand Rathi Wealth Management — experience that shaped the practitioner-first approach ISFM is known for today. He is an active trader and researcher, and his teaching draws directly from live market work rather than theory alone. His areas of focus include technical analysis, derivatives and options strategies, equity research and fundamental analysis, and investor awareness. Sushil is currently a PhD scholar researching options trading strategies, and regularly conducts investor awareness and financial literacy programs for students, professionals and corporate audiences.

three white soldiers candlestick pattern
Blog

Three White Soldiers Candlestick Pattern: Spot the Beginning of a Bullish Trend

If you’re looking to catch strong bullish moves early, then the Three White Soldiers candlestick pattern is one of the most reliable signals in technical analysis. This visually clear and powerful formation signals the end of a downtrend and the start of a fresh bullish rally. In this blog, you’ll discover: What is the Three White Soldiers Pattern? The Three White Soldiers is a bullish reversal pattern made up of three consecutive long green candles that open within the previous candle’s body and close progressively higher. Key Features: This pattern signals strength, conviction, and a shift in momentum from bears to bulls. Psychology Behind the Pattern The market has been in a downtrend or has recently bottomed out. Suddenly, buyers step in with increasing force over three consecutive sessions: How to Identify the Three White Soldiers Pattern Here’s what to look for: How to Trade the Three White Soldiers Pattern Entry: Stop Loss: Targets: Pros and Cons of the Pattern Pros: Cons: Learn to Trade Patterns Like This at ISFM At ISFM – International School of Financial Market, we go beyond theory and teach real-time candlestick trading using: 📘 Our Top Courses: 👉 Technical Analysis Course in Gurgaon👉 Chartered Stock Trading Expert (CSTX) Course👉 Stock Trading Courses – Online & Offline ✅ Live Market Practice Sessions✅ SEBI/NISM Certification Support✅ One-on-One Mentorship✅ 100% Placement Assistance 📍 ISFM, Sector-38, Medicity Road, Gurgaon📞 Call: +91 8882000233 | +91 8168573253🌐 Visit: www.isfm.co.in Conclusion The Three White Soldiers candlestick pattern is a powerful, clear, and high-probability bullish reversal signal. When used with proper confirmation and trading discipline, it can set you up for timely entries into trending stocks.

op 5 bullish candlestick pattern
Blog

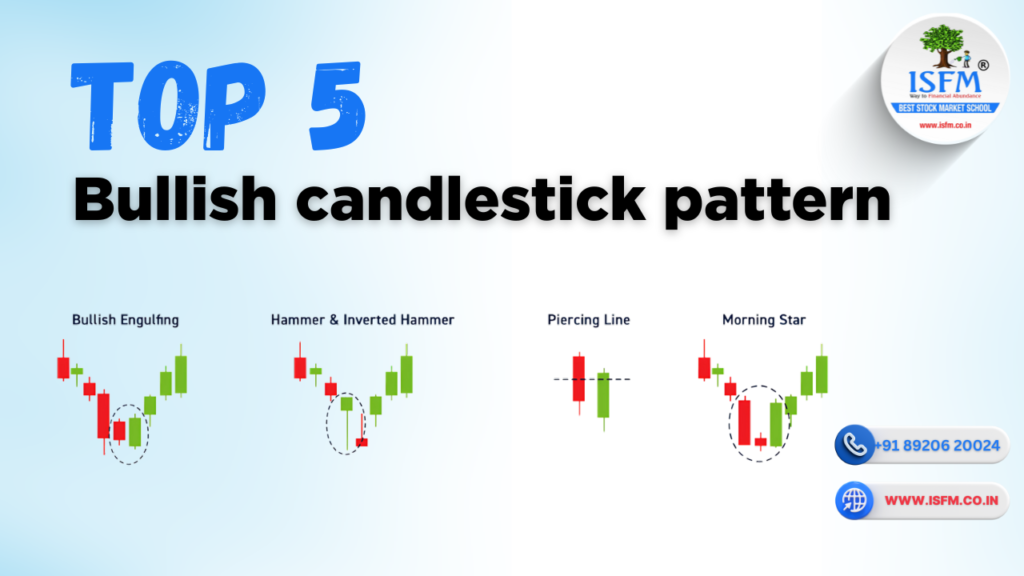
Top 5 Bullish Candlestick Patterns Every Trader Must Know

Candlestick patterns are the heartbeat of price action trading. If you want to spot trend reversals, early buying signals, or momentum breakouts, you need to master a few key bullish candlestick patterns. In this blog, we’ll explore the Top 5 Bullish Candlestick Patterns, including their: 1. Bullish Engulfing Pattern What It Is: A two-candle bullish reversal pattern where the second green candle fully engulfs the previous red candle’s body. It appears after a downtrend, signaling that buyers have taken control. Relevance: Confirmation: Failure Signs: Stop Loss: Special Note: 2. Morning Star PatternWhat It Is: A three-candle bullish reversal pattern appearing after a downtrend: Relevance: Confirmation: Failure Signs: Stop Loss: Special Note: 3. Hammer Candlestick Pattern What It Is: A single candle with a small real body on top and a long lower shadow, appearing after a downtrend. It suggests rejection of lower prices and potential reversal. Relevance: Confirmation: Failure Signs: Stop Loss: Special Note: 4. Piercing Line Pattern What It Is: A two-candle reversal pattern: Relevance: Confirmation: Failure Signs: Stop Loss: Special Note: 5. Three White Soldiers What It Is: A three-candle bullish continuation or reversal pattern, featuring: Relevance: Confirmation: Failure Signs: Stop Loss: Special Note: Learn to Master Candlestick Trading at ISFM At ISFM – International School of Financial Market, we train students to recognize, confirm, and trade bullish candlestick patterns with: Recommended Courses: 🔸 Technical Analysis Course🔸 Chartered Stock Trading Expert – CSTX Course🔸 Full Stock Trading Programs (Online + Offline) ✅ One-on-One Mentorship✅ Free Study Materials & Live Market Practice✅ 100% Placement Support✅ SEBI/NISM Certification Guidance 📞 Call: +91 8882000233 | +91 8168573253📍 Location: Sector-38, Gurgaon🌐 Visit: www.isfm.co.in Conclusion These Top 5 Bullish Candlestick Patterns are essential for any trader serious about market timing and price action. From reversal setups like Bullish Engulfing to strong continuation patterns like Three White Soldiers, each of these candles can give you a technical edge—when used with confirmation and proper risk control.

B-641 What is spining top candlestick_WWW.ISFM.CO.IN
Blog

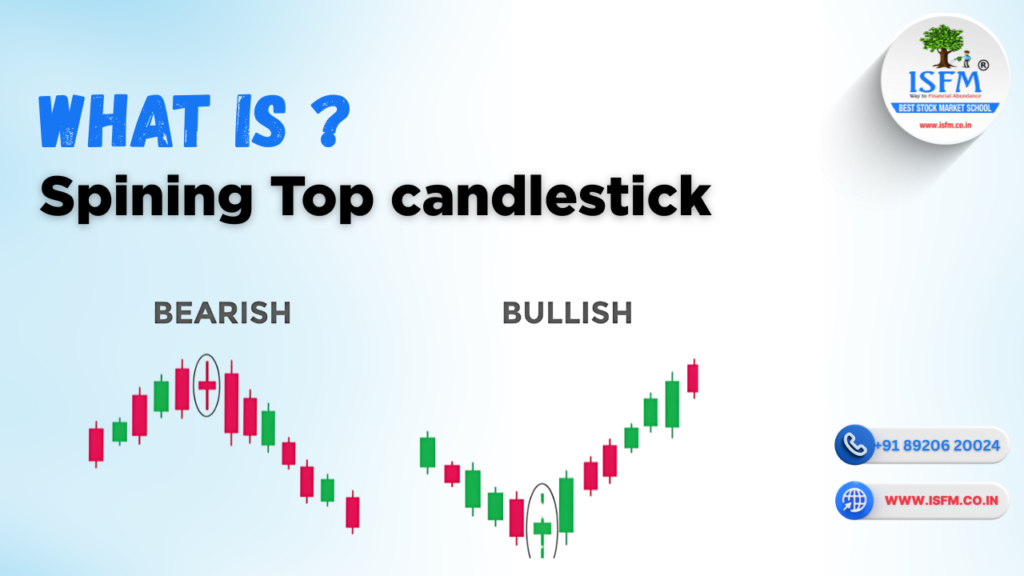
Spinning Top Candlestick Pattern: Meaning, Relevance, and How to Trade It Effectively

In the stock market, candlestick patterns are powerful tools that help traders decode market psychology. Among the most overlooked but insightful patterns is the Spinning Top candlestick—a visual sign of indecision and potential trend change. Whether you’re an intraday trader or a swing trader, understanding this pattern can help you time your entries and exits better and avoid impulsive trades. In this article, we’ll explore: What is a Spinning Top Candlestick? The Spinning Top is a neutral candlestick pattern that forms when the market shows indecision between buyers and sellers. Key Features: 🔍 It’s like a balancing act—buyers try to push up, sellers push down, but neither wins. Why is the Spinning Top Pattern Important? The Spinning Top is a key turning point indicator in the market. Relevance of the Pattern: 🔗 Want to learn to spot turning points in real-time? Explore our Technical Analysis Course in Gurgaon Confirmation of the Spinning Top Pattern The Spinning Top itself is not a standalone signal—confirmation is essential. Look for: Failure of the Spinning Top Pattern Like any pattern, the Spinning Top can fail if used incorrectly. Common Causes of Failure: ⚠️ Don’t rely on visual patterns alone—always trade with market structure in mind. Stop Loss Strategy for Spinning Top To manage risk effectively: 🔗 Learn risk management, candlestick setups, and live trading strategy in our Stock Trading Courses Special Points to Keep in Mind Before trading the Spinning Top pattern, remember: ✅ Use it with confirmation and support/resistance✅ Avoid in low-volume or illiquid stocks✅ Best results on higher timeframes (1H, 4H, Daily)✅ Look for confluence with RSI, MACD, or Fibonacci levels✅ Never rely on it in isolation—context is everything Learn to Master Candlestick Patterns at ISFM We don’t just teach patterns—we train you to apply them live with price action, indicators, and risk control. Our Top Courses for This: ✅ Technical Analysis Course – Live & Online✅ Chartered Stock Trading Expert (CSTX) Course✅ Beginner to Pro Stock Market Courses ✅ Live Market Practice✅ One-on-One Mentorship✅ SEBI/NISM Certification Coaching✅ 100% Placement Assistance✅ Weekend/Weekday Batches (Online + Offline) 📞 Call: +91 8882000233 | +91 8168573253📍 Location: Sector-38, Medicity Road, Gurgaon🌐 Website: www.isfm.co.in Conclusion The Spinning Top candlestick is a powerful visual clue that signals indecision in the market. While not a trade trigger on its own, it helps you stay cautious and wait for confirmation—making it a valuable addition to your trading toolkit.

What is Inverted Hammer candlestick
Blog

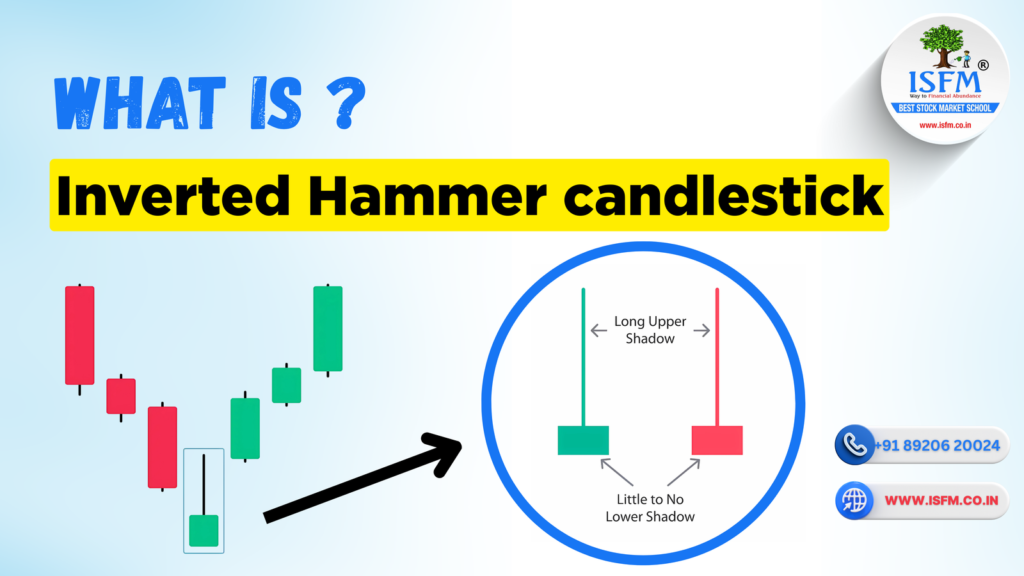
Inverted Hammer Candlestick Pattern: Spotting Bullish Reversals Made Easy

In technical analysis, spotting a trend reversal early can be the difference between catching a winning trade or missing the move altogether. One such powerful bullish reversal signal is the Inverted Hammer candlestick pattern. If you’re looking to identify market bottoms and take early long positions, this pattern deserves your attention. In this article, you’ll learn: Where to learn these setups at ISFM – India’s Best Stock Market School What is the Inverted Hammer Candlestick Pattern? The Inverted Hammer is a single-candle bullish reversal pattern that appears after a downtrend. It signals a potential reversal in market sentiment—indicating that the selling pressure may be weakening and bulls might be ready to take control. Key Characteristics: 🧠 Think of it as the market trying to rise—and showing early signs of strength How the Inverted Hammer Forms? How to Identify an Inverted Hammer? ✅ Appears after a clear downtrend✅ Has a small body near the low✅ Long upper shadow (minimum 2x the body)✅ No or very small lower shadow✅ Requires confirmation: a bullish candle closing above the high of the Inverted Hammer Trading the Inverted Hammer: Step-by-Step Entry Strategy: Stop Loss: Profit Targets: Pros and Cons of the Inverted Hammer Pros: Cons: Master Candlestick Patterns at ISFM At ISFM – International School of Financial Market, we help students master candlestick psychology, trading patterns, and live chart reading. Popular Courses to Learn: ✅ Technical Analysis Course – Live & Online✅ CSTX – Chartered Stock Trading Expert Program✅ Stock Trading Courses for Beginners & Professionals ✅ One-on-One Mentorship✅ SEBI/NISM Certification Support✅ 100% Placement Assistance✅ Free Study Material + Recorded Backup 📞 Call Now: +91 8882000233 | +91 8168573253📍 Location: Sector-38, Gurgaon🌐 Website: www.isfm.co.in Conclusion The Inverted Hammer is a reliable and easy-to-spot candlestick pattern that helps traders catch the start of a bullish reversal—especially after a downtrend. When combined with proper confirmation, risk management, and confluence, it becomes a powerful entry signal. 🚀 Want to trade candlestick setups like a pro? Join ISFM – India’s Best Stock Market School and turn knowledge into real trading success.

What is Shooting start candlestick pattern
Blog

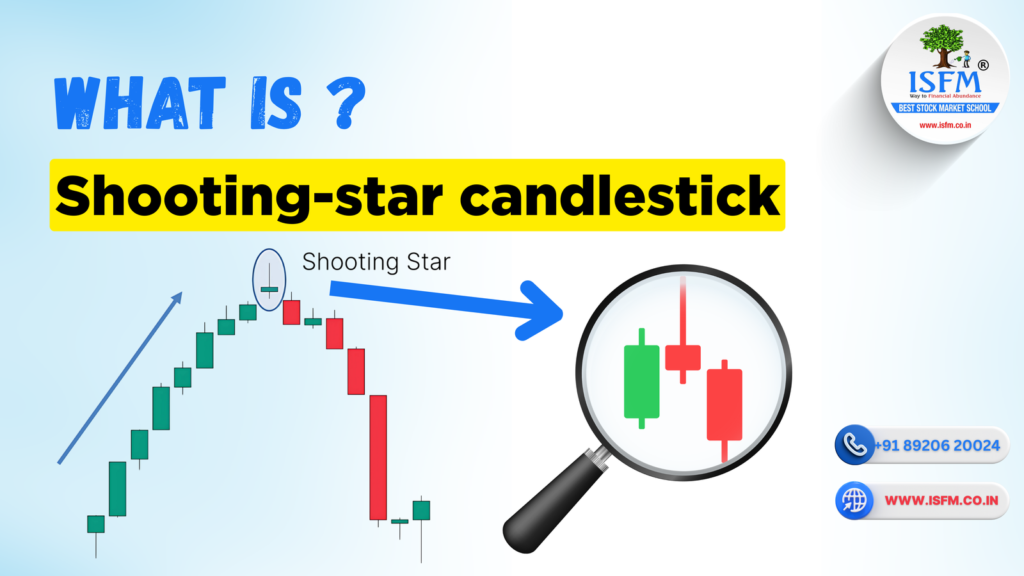
Shooting Star Candlestick Pattern: Spotting Bearish Reversals Before They Drop

In technical analysis, timing is everything. Knowing when a bullish trend is losing steam can save you from losses and even help you profit. The Shooting Star candlestick pattern is one of the clearest early-warning signs of a bearish reversal. This guide will walk you through: What is a Shooting Star Candlestick? The Shooting Star is a single-candle bearish reversal pattern that appears after an uptrend. It has a small real body, little to no lower shadow, and a long upper wick, showing that buyers failed to hold higher prices. Key Features: Think of it like a star shooting up… and quickly falling back—exactly what happens to price How the Shooting Star Forms? How to Identify a Shooting Star? To qualify as a valid Shooting Star: ✅ It must form after an uptrend✅ The upper wick is long (typically 2x the body)✅ The real body is small and near the low of the candle✅ Ideally, there’s little or no lower shadow✅ Confirmation from the next candle closing lower increases accuracy How to Trade the Shooting Star Pattern? Entry Strategy: Stop Loss: Target: Pros and Cons of the Shooting Star Pattern Pros: Cons: Master Shooting Star & Candlestick Trading at ISFM At ISFM – International School of Financial Market, we teach how to trade candlestick patterns in real markets using price action, confluence, volume analysis, and risk management. Our Most Popular Courses: 🔹 Technical Analysis Course (Gurgaon & Online)🔹 CSTX – Chartered Stock Trading Expert Program🔹 Stock Market Courses – Beginner to Advanced ✅ Live Market Training + Recorded Classes✅ Free Study Material + Strategy PDFs✅ 100% Placement Assistance✅ SEBI/NISM Certification Guidance 📞 Call Now: +91 8882000233 | +91 8168573253📍 Offline in Gurgaon | Online across India🌐 Visit: www.isfm.co.in Conclusion The Shooting Star candlestick pattern is a powerful tool for spotting potential market tops and preparing for reversals. It gives traders an early exit signal or a low-risk shorting opportunity. 🚀 Want to learn how to trade Shooting Star, Doji, Engulfing, and more with confidence? Join ISFM – India’s Best Stock Market School and master the market with expert mentors.

B-638 What is Hanging man candlestick pattern_WWW.ISFM.CO.IN
Blog

Hanging Man Candlestick Pattern: A Warning Sign for Traders

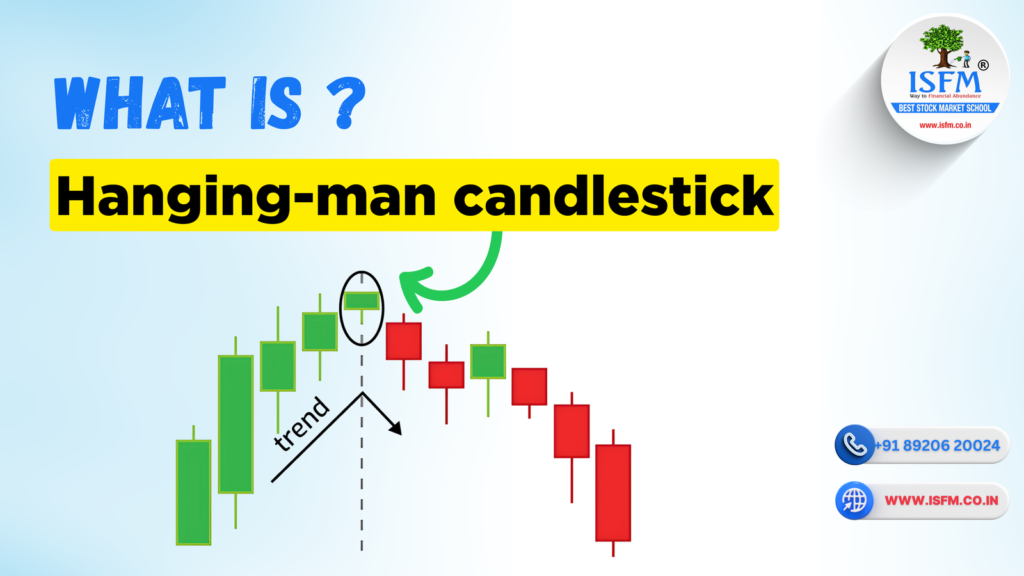
In the world of technical analysis, candlestick patterns help traders make informed decisions by revealing market psychology. One of the most reliable bearish reversal indicators at the top of an uptrend is the Hanging Man candlestick pattern. If you’re trading in an overbought market or suspect a trend is losing steam, spotting a Hanging Man can save you from major losses—or even help you profit from reversals. In this blog, we’ll cover: What is a Hanging Man Candlestick? The Hanging Man is a single-candle bearish reversal pattern that appears after a strong uptrend. It looks just like a Hammer but appears at the top, not the bottom. Key Characteristics: It reflects weakening buyer strength and the possible entry of sellers. How Does the Hanging Man Form? It’s a sign that sellers are testing the waters—and bulls are starting to tire. How to Identify a Hanging Man? Use the following checklist to spot a true Hanging Man: ✅ Appears after a noticeable uptrend✅ Small real body at the top of the range✅ Long lower shadow (at least twice the body)✅ Little or no upper wick✅ Ideally confirmed with next bearish candle or high volume Learn how to read patterns like this inside our Technical Analysis Course. How to Trade the Hanging Man Pattern? Entry Strategy: Stop Loss: Target: We cover this trading logic live in our CSTX – Chartered Stock Trading Expert Course Pros and Cons of Hanging Man Pattern Pros: Cons: Master Candlestick Trading with ISFM To become a consistently profitable trader, you need more than just theory—you need practical, live experience with candlestick setups like Hanging Man, Doji, Shooting Star, and more. 🔗 Our Best Courses for This: 📘 Technical Analysis Course – Online/Offline📘 Chartered Stock Trading Expert (CSTX)📘 Stock Trading Courses for Beginners & Professionals ✅ One-on-One Mentorship✅ NISM Certification Guidance✅ Free Study Material & Backup Recordings✅ 100% Placement Assistance 📍 Sector-38, Medicity Road, Gurgaon📞 Call Now: +91 8882000233 | +91 8168573253🌐 Visit: www.isfm.co.in Conclusion The Hanging Man is a simple yet powerful candlestick pattern that signals trend exhaustion and possible reversal. When used in the right context, it can help you exit long trades early or prepare for short entries with low risk. 🚀 Want to learn candlestick patterns in live markets? Join ISFM – India’s Best Stock Market School and turn your trading passion into profit!

how to make money in intraday trading
Blog

How to Make Money in Intraday Trading: Strategies, Features, and Benefits & Challenges

Intraday trading—commonly known as day trading—is a dynamic way to earn profits from short-term price movements in the stock market. Unlike long-term investing, it involves entering and exiting trades on the same day. While it presents exciting profit potential, intraday trading also demands sharp analytical skills, strict discipline, and a clear strategy. This comprehensive guide covers everything you need to know about making money through intraday trading, including its key features, strategies, pros, cons, and expert tips for success. What is Intraday Trading? Intraday trading involves buying and selling financial instruments such as stocks, commodities, or forex within a single trading session. All positions are squared off before the market closes, eliminating overnight exposure. Traders aim to profit from price volatility, news-driven spikes, and technical patterns. Key Features of Intraday Trading Why is Intraday Trading Important? Pros and Cons of Intraday Trading Advantages Disadvantages Top Strategies to Make Money in Intraday Trading 6 Pro Tips for Intraday Trading Success Frequently Asked Questions (FAQs) Q1. What’s the best time for intraday trading? A: The first hour after the market opens (9:15 AM to 10:30 AM IST) typically offers high volatility and ideal trading opportunities. Q2. How much capital is required to start intraday trading? A: A minimum of ₹20,000 to ₹50,000 is recommended for Indian markets, but capital needs may vary depending on strategy and risk appetite. Q3. Is intraday trading suitable for beginners? A: Yes, but success requires learning, patience, and emotional discipline. Beginners should start small and focus on education. Q4. What makes intraday trading risky? A: Intraday trading is highly volatile, and without proper risk control, losses can be swift and substantial. Q5. How much can I realistically earn in a day? A: Earnings depend on capital, strategy, and discipline. A consistent 1–2% return per day is possible for experienced traders. Conclusion Intraday trading offers exciting opportunities, but it’s not a shortcut to instant wealth. With the right approach—backed by education, strategy, and risk control—you can build a profitable trading journey. Focus on protecting your capital, follow your plan, and evolve your trading style over time. Remember: consistency and discipline are the real keys to success in intraday trading.

rbi lrs policy
Blog

RBI’s Liberalized Remittance Scheme (LRS): A Gateway to Global Financial Access

The Reserve Bank of India (RBI) has played a transformative role in opening India’s financial ecosystem to the global market. One of its most significant initiatives is the Liberalized Remittance Scheme (LRS), launched in 2004. Designed to empower individuals to send money abroad legally and seamlessly, the LRS continues to shape how Indians engage with the world financially. In this guide, we’ll explore the LRS policy in detail—its meaning, importance, features, and the wider impact it has on India’s economy and financial markets. What is the Liberalized Remittance Scheme (LRS)? The LRS is an RBI initiative that allows Indian residents, including minors, to remit up to $250,000 per financial year for permissible current or capital account transactions—without needing prior approval from the RBI. This amount can be used for: The scheme reflects India’s move toward a liberalized foreign exchange regime, balancing ease of access with regulatory oversight. Why is the LRS Policy Crucial? 1. Empowers Global Investment The LRS enables individuals to diversify their portfolios internationally by investing in foreign equities, ETFs, and even overseas property (subject to local laws). This reduces dependency on domestic markets and improves risk-adjusted returns. 2. Simplifies Overseas Education & Healthcare Families can transfer tuition fees or medical expenses abroad without bureaucratic delays—making global education and healthcare more accessible. 3. Supports Personal Financial Freedom Whether you’re funding your child’s education or investing in a U.S. stock, LRS gives you greater control over your wealth. 4. Controlled Capital Outflows With a set annual limit, the scheme ensures India’s foreign exchange reserves remain stable, even as outward remittances grow. 5. Improves Transparency & Compliance The LRS encourages legal remittances, with mandatory tax and documentation processes. It also helps the government monitor and prevent money laundering or tax evasion. Also Read: Structure of the Indian Stock Market: Features, Significance & Distinctive Attributes How Does LRS Impact Indian Financial Markets? 1. Promotes Global Market Participation Retail and HNI investors are using LRS to invest in U.S. stocks, mutual funds, and international bonds, encouraging cross-border capital flow. 2. Influences Exchange Rate Movements Heavy outflows under LRS can put pressure on the Indian Rupee (INR). However, the $250,000 cap and RBI interventions help maintain currency stability. 3. Drives Innovation in Banking & Fintech Banks, NBFCs, and fintech companies have launched specialized remittance platforms and advisory services to serve LRS users—boosting competition and efficiency. 4. Encourages Growth in Education and Healthcare The scheme has indirectly benefited edtech firms, study abroad consultants, and medical tourism by simplifying global fund transfers. 5. Raises Policy Debates The 2023 increase in Tax Collected at Source (TCS) to 20% on many LRS transactions has sparked criticism. Many argue it places an undue burden on middle-class families. Who Can Use LRS? Tax Implications Under LRS (2024 Update) Conclusion: LRS as India’s Financial Bridge to the World The RBI’s Liberalized Remittance Scheme is a powerful policy that unlocks global opportunities for Indian residents while maintaining macroeconomic stability. As India’s economic footprint grows, the LRS will continue playing a vital role in enabling cross-border financial empowerment, fostering a globally connected investment culture. Whether you’re an investor exploring foreign markets, a parent funding education abroad, or a traveler planning your next trip, the LRS is your legal and efficient route to send money overseas.

structure of Indian stock market
Blog

Structure of the Indian Stock Market: Features, Significance & Distinctive Attributes

The Indian stock market is a vibrant and evolving ecosystem, acting as a catalyst for economic development, wealth creation, and foreign capital inflow. To navigate this landscape effectively, it’s crucial to understand its structure, core components, and the factors that set it apart from global markets. Understanding the Structure of the Indian Stock Market India’s stock market operates within a well-regulated and organized framework. It consists of multiple entities working in harmony—stock exchanges, regulators, market participants, and technological infrastructure. 1. Major Stock Exchanges 2. Regulatory Authority 3. Market Segments 4. Depositories 5. Intermediaries These include stock brokers, mutual funds, depository participants, and registrars—each playing a crucial role in market operations. Salient Features of the Indian Stock Market Importance of the Indian Stock Market Also Read: Top 5 Regulatory Bodies of the Indian Financial Market: Roles, Impact & Future Vision What Sets the Indian Stock Market Apart? Challenges & Future Outlook While the Indian stock market faces issues like volatility and lack of financial awareness, efforts from SEBI, educational initiatives, and fintech startups are closing the gap. With a market cap of $4.3 trillion (2023), India is poised to hit $10 trillion by 2030—paving the way for its stock market to become a global financial hub. Frequently Asked Questions (FAQs) Q1: How does SEBI protect investors?SEBI enforces transparency, regulates market participants, and handles complaints through its redressal system, SCORES. Q2: What’s the key difference between BSE and NSE?BSE has a larger number of listed companies, while NSE leads in volumes, especially in derivatives trading and technology adoption. Q3: Can foreigners invest in Indian equities?Yes, via Foreign Portfolio Investments (FPI) or India-focused ETFs like iShares MSCI India. Conclusion India’s stock market is not only well-structured and highly regulated but also uniquely characterized by tech adoption, retail participation, and cultural nuances. For investors—both domestic and global—understanding this market means unlocking vast opportunities in one of the world’s fastest-growing economies.

• Indian financial regulators
Blog

Top 5 Regulatory Bodies of the Indian Financial Market: Roles, Impact & Future Vision

The Indian financial market is anchored in transparency, trust, and innovation, all made possible by a network of powerful regulatory authorities. These institutions not only uphold financial discipline but also shape the direction of India’s economic evolution. In this guide, we spotlight the top 5 financial regulatory bodies in India, their core responsibilities, market impact, and vision for the future. 1. Securities and Exchange Board of India (SEBI) Why SEBI Matters As the primary regulator for the securities market, SEBI ensures investor protection and facilitates fair trade practices. Its regulatory purview spans across stock exchanges, brokers, mutual funds, and more. Key Responsibilities Forward Vision 2. Reserve Bank of India (RBI) Why RBI Matters The RBI acts as the monetary and banking regulator of India. It balances growth with inflation control while promoting financial inclusion. Key Responsibilities Forward Vision Impact on Market Strengthens the banking infrastructure, maintains price stability, and promotes digital payment adoption. 3. Insurance Regulatory and Development Authority of India (IRDAI) Why IRDAI Matters IRDAI oversees India’s insurance sector, ensuring companies act ethically while offering value to policyholders. Key Responsibilities Forward Vision Impact on Market Fosters trust in insurance products and enhances penetration across underserved demographics. 4. Pension Fund Regulatory and Development Authority (PFRDA) Why PFRDA Matters Tasked with overseeing pension frameworks like the National Pension System (NPS), PFRDA ensures a secure financial future for Indian citizens. Key Responsibilities Forward Vision Impact on Market Encourages long-term investing habits and reduces pressure on public retirement systems. Also Read: Algorithmic Trading Explained: Features, Benefits, Future Trends & Should You Use It? 5. Financial Stability and Development Council (FSDC) Why FSDC Matters FSDC acts as a super-regulator, promoting coordination among bodies like RBI, SEBI, IRDAI, and PFRDA to maintain systemic stability. Key Responsibilities Forward Vision Impact on Market Enables a holistic regulatory framework, reducing sectoral conflicts and increasing economic resilience. How These Regulatory Bodies Transform the Financial Landscape Vision 2030: What Lies Ahead India’s financial regulators are gearing up for a transformative decade. Here’s what to expect: Conclusion India’s financial regulators — SEBI, RBI, IRDAI, PFRDA, and FSDC — are pillars of the nation’s economic success. Through proactive policy-making, technology adoption, and stakeholder protection, these bodies not only safeguard the present but also shape a robust, inclusive, and future-ready financial ecosystem.

Scroll to Top