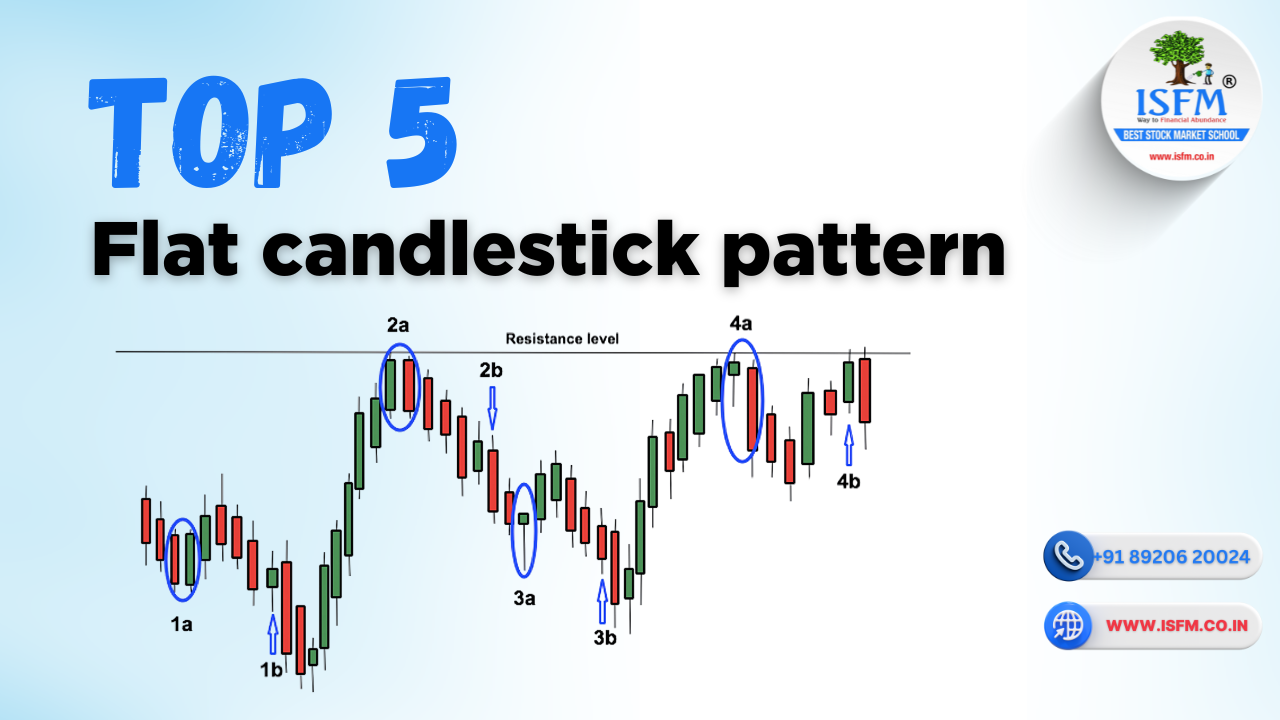
In technical analysis, not every candlestick signals a clear direction. Some candles represent indecision, exhaustion, or balance between buyers and sellers. These are known as Flat Candlestick Patterns—neutral setups that often appear before major breakouts or reversals.
In this blog, we will uncover the Top 5 Flat Candlestick Trading Patterns, their trading significance, and how to use them effectively. We’ll cover:
- Relevance of each pattern
- How to confirm them
- Where they fail
- How to set stop loss
- Special tips for trading flat candlesticks
- Where to master these patterns with ISFM’s expert-led courses
1. Doji Candlestick
What Is It?
The Doji has an almost equal open and close, forming a cross-like shape. It indicates indecision in the market.
Relevance:
- Appears during consolidation or trend exhaustion
- Signals possible reversal or continuation depending on confirmation
Confirmation:
- Wait for the next candle to break decisively above or below the Doji
- Confirmation works best near support/resistance levels
Failure Signs:
- Appears too frequently in low-volume markets
- Used without confirmation
Stop Loss:
- For bullish breakouts: below Doji’s low
- For bearish breakdowns: above Doji’s high
Special Tips:
- Combine with RSI, MACD, or volume divergence
- Strongest on daily or 4H charts
2. Spinning Top
What Is It?
A small-bodied candle with long upper and lower wicks, signaling market indecision or pause in momentum.
Relevance:
- Appears after extended moves (bullish or bearish)
- Signals potential reversal or continuation
Confirmation:
- Enter trade only after a breakout candle confirms direction
- Volume and trend context are key
Failure Signs:
- Occurs in sideways markets with no trend
- False signals without confirmation
Stop Loss:
- Below the low (for bullish breakout)
- Above the high (for bearish breakdown)
Special Tips:
- Avoid trading in isolation
- Use support/resistance and volume confirmation
3. Long-Legged Doji
What Is It?
A variation of the Doji with very long upper and lower shadows, reflecting extreme indecision or volatility.
Relevance:
- Suggests market is at a tipping point
- Precedes high-impact moves when near critical zones
Confirmation:
- Enter only after a break of the high or low of the Long-Legged Doji
- Combine with trendlines or Fibonacci retracement
Failure Signs:
- Appears on thinly traded instruments
- Small follow-through after breakout
Stop Loss:
- Place below the low (bullish) or above the high (bearish)
Special Tips:
- Powerful when appearing with news, earnings, or trend exhaustion
4. Inside Bar (Flat Formation)
🔍 What Is It?
An Inside Bar is when the entire candle is contained within the range of the previous candle—indicating consolidation or pause.
Relevance:
- Flat, non-volatile formation during trend pauses
- Often signals breakout or breakdown to come
Confirmation:
- Trade the breakout of the Inside Bar’s high/low
- Look for volume breakout and trend alignment
Failure Signs:
- Choppy price action after breakout
- Appears frequently in sideways zones
Stop Loss:
- Below low (for upside breakout), or above high (for downside)
Special Tips:
- Combine with momentum indicators or EMA bounce
5. Four-Price Doji
🔍 What Is It?
A rare pattern where open, close, high, and low are all the same or nearly identical. It appears as a single flat line on the chart.
Relevance:
- Indicates extreme indecision or illiquid trading
- Watch for breakout moves afterward
Confirmation:
- Only trade with strong breakout confirmation
- Confirm direction using trendlines or moving averages
Failure Signs:
- Most often found in illiquid or low-volume assets
- Lacks predictive power without context
Stop Loss:
- Use tight stops just outside the high/low zone
Special Tips:
- Avoid trading alone—look for volume and trend confirmation
Learn Flat & Reversal Patterns at ISFM
At ISFM – International School of Financial Market, we help students and traders:
- Read candlestick signals in live markets
- Combine patterns with volume, RSI, and trendlines
- Build real trading strategies with risk management
📚 Our Most Popular Courses:
🎓 Technical Analysis Course – Online & Offline
🎓 Chartered Stock Trading Expert – CSTX
🎓 Stock Market Trading Courses (Beginner to Pro)
✅ SEBI/NISM Certification Training
✅ One-on-One Mentorship
✅ 100% Placement Assistance
✅ Weekend & Online Batches Available
📞 Call Now: +91 8882000233 | +91 8168573253
📍 ISFM, Sector-38, Medicity Road, Gurgaon
🌐 Visit: www.isfm.co.in
Conclusion
Flat candlestick patterns may not be dramatic—but they are powerful signs of what’s coming next. By learning how to identify and confirm these setups, you’ll be better equipped to anticipate breakouts, avoid traps, and trade smarter.