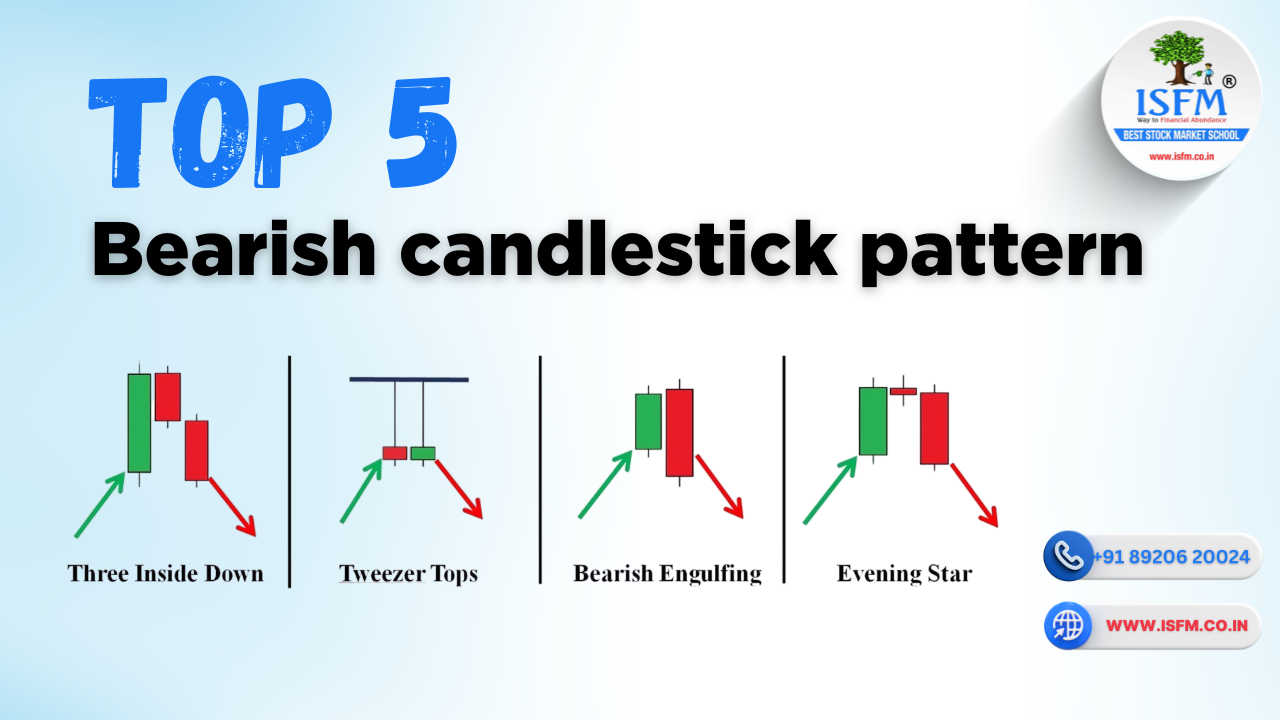
When the market signals weakness, you need to be prepared. Knowing how to identify bearish candlestick patterns can help you protect profits, avoid traps, and even capitalize on trend reversals.
In this blog, we’ll break down the Top 5 Bearish Candlestick Patterns that signal potential downturns, and cover:
- Their relevance and market psychology
- How to confirm them before entering trades
- Where to place stop losses
- What causes pattern failures
- Special tips for successful execution
- And where to master these patterns with ISFM’s live stock trading courses
1. Bearish Engulfing Pattern
What Is It?
A two-candle reversal pattern where the second candle (red) completely engulfs the body of the first candle (green). It forms after an uptrend and signals strong selling pressure.
Relevance:
- Indicates a sudden momentum shift from buyers to sellers
- Ideal for swing and short-term traders
Confirmation:
- Enter after the next candle breaks the low of the engulfing candle
- Volume spike = stronger signal
Failure Signs:
- Pattern forms in consolidation zones
- Engulfing candle has low volume
Stop Loss:
- Above the high of the engulfing candle
Special Point:
- Use with resistance or overbought RSI for high accuracy
2. Evening Star Pattern
What Is It?
A three-candle reversal pattern:
- Large bullish candle
- Small indecision candle (Doji or Spinning Top)
- Strong bearish candle closing into the first candle’s body
Relevance:
- Appears after a rally, signaling buyer exhaustion
- Strong early warning of a potential trend reversal
Confirmation:
- Entry after third candle closes below midpoint of the first
- Best with confirmation from volume or RSI divergence
Failure Signs:
- Third candle is weak
- Appears in low-volume stocks
Stop Loss:
- Above the high of the middle candle
Special Point:
- Combine with moving average or resistance zone
3. Shooting Star Pattern
What Is It?
A single bearish reversal candle with a small real body near the low and a long upper wick, appearing at the top of an uptrend.
Relevance:
- Indicates rejection of higher prices
- Often marks the end of bullish momentum
Confirmation:
- Entry after the next candle breaks below the low of the Shooting Star
- Add volume or MACD confirmation
Failure Signs:
- Weak follow-through candle
- Appears during sideways market
Stop Loss:
- Above the high of the Shooting Star
Special Point:
- Use on higher timeframes (1H, Daily) for best results
4. Dark Cloud Cover
What Is It?
A two-candle bearish reversal pattern where:
- First candle is strong bullish
- Second is bearish and closes below the midpoint of the first
Relevance:
- Indicates early signs of seller dominance
- Reliable signal when formed near resistance
Confirmation:
- Wait for second candle to close strongly
- Confirm with volume or Bearish RSI divergence
Failure Signs:
- Appears in low-volatility zones
- Bearish candle is too small
Stop Loss:
- Above the high of the pattern
Special Point:
- Use with trendline resistance for better results
5. Hanging Man Pattern
What Is It?
A single-candle pattern with a small real body at the top and a long lower shadow, formed after an uptrend.
Relevance:
- Early warning that bullish momentum is weakening
- Bears are testing lower levels
Confirmation:
- Enter on the next candle breaking below the Hanging Man’s low
Failure Signs:
- No confirmation candle
- Appears in sideways markets
Stop Loss:
- Above the high of the Hanging Man
Special Point:
- Best used with volume confirmation or RSI divergence
Learn Reversal Patterns with ISFM
At ISFM – International School of Financial Market, we teach how to use bearish candlestick patterns strategicallywith confluence tools like:
- Market structure & trendlines
- Volume confirmation
- RSI, MACD, Fibonacci retracements
- Real-time chart analysis
Our Top Courses Include:
📘 Technical Analysis Course – Online & Offline
📘 CSTX – Chartered Stock Trading Expert Course
📘 Stock Trading Courses for Beginners & Traders
✅ Live Market Practice
✅ Free Study Material + Backup Videos
✅ SEBI/NISM Certification Prep
✅ 100% Placement Assistance 📞 Call Now: +91 8882000233 | +91 8168573253
📍 ISFM, Sector-38, Gurgaon
🌐 Visit:www.isfm.co.in
Conclusion
These Top 5 Bearish Candlestick Patterns can help you protect your capital, spot reversals early, and even profit from market corrections. Whether you’re a beginner or active trader, learning to use these patterns with confirmation and risk control will take your trading game to the next level.