Author name: Mr. Sushil Alewa

Sushil Alewa is the Founder & Director of ISFM – International School of Financial Market, established in July 2014 with the aim of bridging the gap between academic finance and real, practical market participation. A Certified Financial Planner - CFP from US (Reg. No. IN 51734) and SEBI Registered Research Analyst (Reg. No. INH100009433) with an MBA in finance, Sushil has spent more than 16 years in the Indian capital markets. His career spans equity advisory and research at Sharekhan, India Infoline, Indiabulls and Religare, followed by HNI portfolio advisory at Anand Rathi Wealth Management — experience that shaped the practitioner-first approach ISFM is known for today. He is an active trader and researcher, and his teaching draws directly from live market work rather than theory alone. His areas of focus include technical analysis, derivatives and options strategies, equity research and fundamental analysis, and investor awareness. Sushil is currently a PhD scholar researching options trading strategies, and regularly conducts investor awareness and financial literacy programs for students, professionals and corporate audiences.

B-556 Best intraday trading strategy
Blog

Best Intraday Trading Strategies: Features, Pros, Cons & Profit Tips

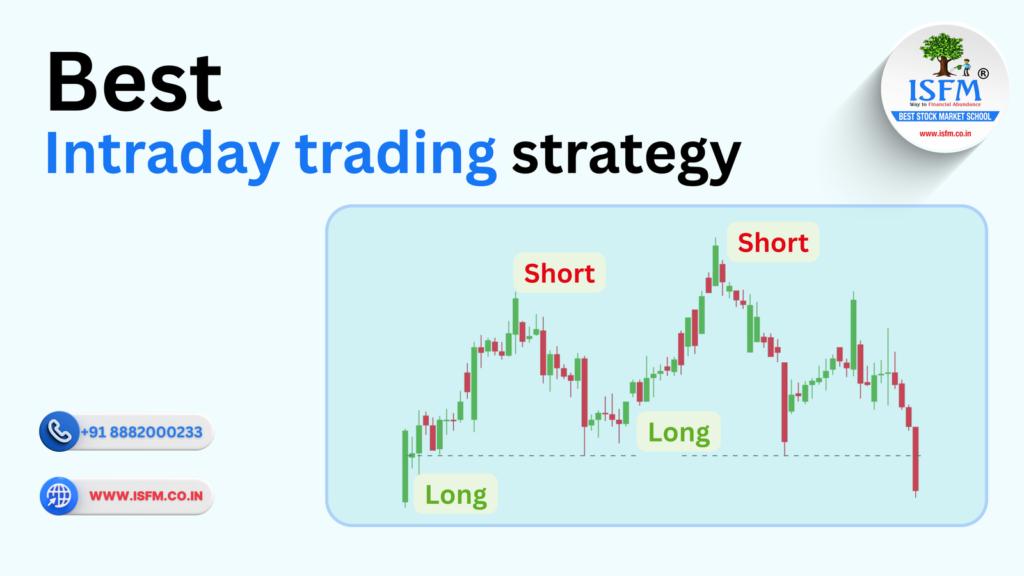
Intraday trading, also known as day trading, involves buying and selling stocks or other financial instruments within the same trading session. The goal is to take advantage of short-term market movements without holding positions overnight. A winning strategy, strong discipline, and real-time market awareness are essential. In this blog, we dive into the best intraday trading strategies with detailed insights into their features, pros and cons, and practical tips for maximizing profits. 1. Scalping Strategy Overview: Scalping is a high-frequency trading method that aims to capture small price movements by executing multiple trades in a day. Key Features: Pros: Cons: Profit Tips: 2. Momentum Trading Overview: This strategy focuses on stocks showing strong price trends, usually triggered by news or high volume activity. Key Features: Pros: Cons: Profit Tips: Also Read: PCR Ratio: Mastering Market Sentiment for Smarter Trading Decisions 3. Breakout Trading Breakout traders aim to profit when a stock breaks out of a predefined resistance or support level. Key Features: Pros: Cons: Profit Tips: 4. Range Trading Range trading relies on price bouncing between support and resistance levels within a sideways market. Key Features: Pros: Cons: Profit Tips: 5. News-Based Trading This strategy capitalizes on price volatility caused by breaking news, earnings announcements, or economic data. Key Features: Pros: Cons: Profit Tips: Top Tips for Intraday Trading Success Conclusion Choosing the best intraday trading strategy depends on your trading style, risk appetite, and market conditions. To succeed, combine a proven strategy with strict discipline and risk control. Start with paper trading or a demo account to refine your skills and gradually move to live trading.

B-558 What is PE Ratio in stock market_WWW.ISFM.CO.IN
Blog

Understanding P/E Ratio in the Stock Market: Meaning, Features, and Importance & How to Use It Profitably

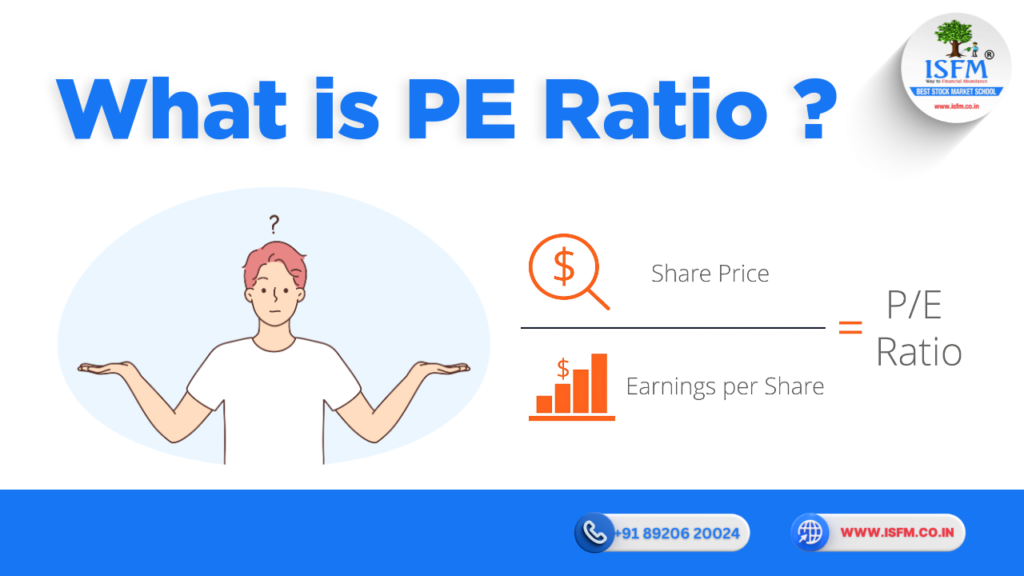
In the world of stock market investing, one of the most commonly used financial metrics is the P/E Ratio, or Price-to-Earnings Ratio. It’s a fundamental tool used by investors, analysts, and traders to assess a company’s valuation and future potential. But what exactly is the P/E ratio, and how can market participants use it to make informed decisions and even generate profits? Let’s dive deep into this essential stock market indicator. What is P/E Ratio? The Price-to-Earnings (P/E) Ratio is a financial metric that compares a company’s current market price per share to its earnings per share (EPS). It helps investors evaluate whether a stock is overvalued, undervalued, or fairly priced. P/E Ratio Formula: P/E Ratio = Market Price per Share / Earnings per Share (EPS) For example, if a company’s stock is trading at ₹200 and its EPS is ₹20, the P/E ratio would be 10. Key Features of P/E Ratio Importance of P/E Ratio in Investing Pros of Using P/E Ratio Cons of Using P/E Ratio How Market Participants Can Make Money Using P/E Ratio Real-Life Example Let’s say Company A and Company B are in the FMCG sector: If both have similar growth prospects and Company A has strong fundamentals, investors may prefer it due to its lower P/E—indicating better value. Pro Tip Always use the P/E ratio with other metrics like PEG Ratio, Debt-to-Equity, and Return on Equity (ROE) to make a holistic investment decision. Final Thoughts The P/E Ratio is a powerful yet simple tool to evaluate stock prices and make smart investment choices. Whether you’re a beginner investor or a seasoned trader, understanding how to interpret and use P/E ratio can significantly improve your ability to spot opportunities in the market. However, like any tool, it works best when used in context and in combination with other financial indicators. Learn Stock Market Investing with ISFM Gurgaon If you’re interested in mastering such financial concepts and making intelligent investment decisions, join our Stock Market Courses at ISFM, Gurgaon’s premier stock market training institute. Learn from market experts and build a solid foundation in equity investing and trading.

16_What is PCR Ratio
Blog

PCR Ratio: Mastering Market Sentiment for Smarter Trading Decisions

The Put-Call Ratio (PCR) is a widely-used market sentiment indicator in options trading, helping traders understand whether the market is leaning more towards bearish puts or bullish calls. Formula: PCR Ratio=Total Put Volume (or Open Interest)Total Call Volume (or Open Interest)text{PCR Ratio} = frac{text{Total Put Volume (or Open Interest)}}{text{Total Call Volume (or Open Interest)}} Generally: How to Analyze and Interpret the PCR Ratio Why is the PCR Ratio a Must-Know for Traders? Also Read: Circuit Breakers in the Indian Stock Market: Everything You Need to Know Key Benefits of Using the PCR Ratio Pros and Cons of the PCR Ratio Pros Cons Easy to calculate & interpret Needs context (e.g., hedging activity vs. speculation) Powerful contrarian trading signal Not a standalone indicator—requires confirmation Followed by professional traders & analysts Asset-specific variations (Index PCR ≠ Stock PCR) Strategies to Profit Using the PCR Ratio Frequently Asked Questions (FAQs) Q1: Can PCR anticipate market crashes? Not on its own. But extreme PCR readings (e.g., above 1.5) can indicate capitulation or mass panic—often preceding market bottoms. Use alongside macro indicators. Q2: Where can I check PCR Ratio data? Visit NSE India, CBOE, or TradingView for up-to-date PCR data. Q: Is PCR reliable for individual stocks? Yes, but watch for manipulation due to institutional hedging. For better accuracy, analyze index-level PCR like Nifty or Bank Nifty.PCR Ratio: Mastering Market Sentiment for Smarter Trading Decisions Q: Is PCR reliable for individual stocks? Yes, but watch for manipulation due to institutional hedging. For better accuracy, analyze index-level PCR like Nifty or Bank Nifty. Conclusion: Turn Sentiment Into Strategy The PCR Ratio offers powerful insight into market psychology. When used with technical tools and a solid risk framework, it can help you anticipate market turns and trade with greater confidence.

Circuit Breakers in the Indian Stock Market:
Blog

Circuit Breakers in the Indian Stock Market: Everything You Need to Know

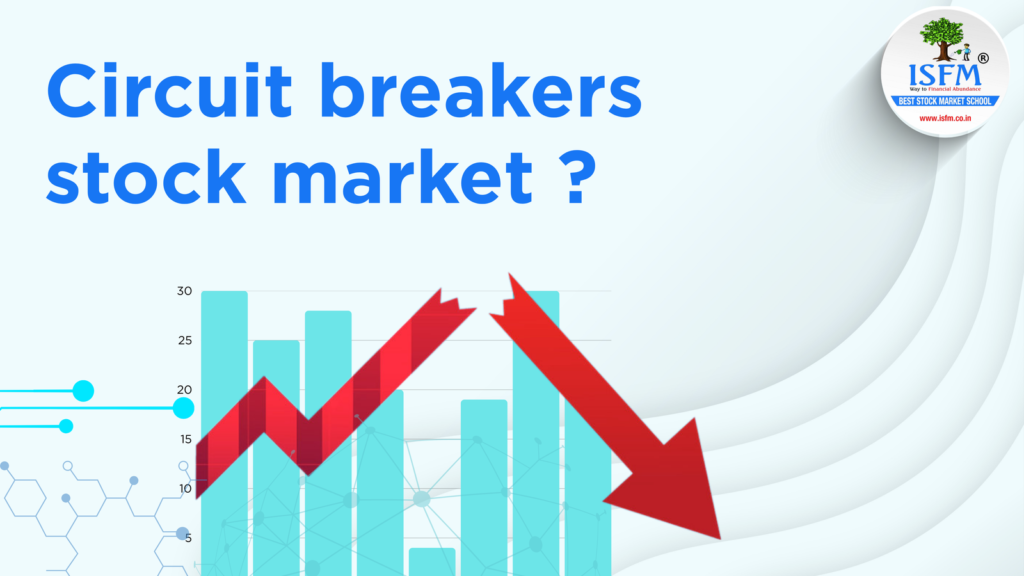
In times of extreme market volatility, circuit breakers serve as crucial risk-control mechanisms in the Indian stock market. These automatic trading halts are designed to prevent panic-induced crashes and maintain orderly market conditions. In this guide, we’ll delve into how circuit breakers work, SEBI regulations, their importance, and real-world examples from Indian exchanges like the NSE and BSE. What Are Circuit Breakers in Stock Markets? Circuit breakers are predefined thresholds that temporarily pause trading activity when indices like the Nifty 50 or Sensex move sharply in either direction. These halts act as a “cooling-off period,” helping investors absorb market developments without making impulsive decisions. Circuit Breaker Rules in India: SEBI Guidelines The Securities and Exchange Board of India (SEBI) has laid out a two-tier circuit breaker system that includes index-based halts and stock-specific price bands: 1. Index-Based Circuit Breakers Triggered when either the Nifty 50 or Sensex moves by 10%, 15%, or 20% in a single trading day: 2. Stock-Specific Circuit Limits Each stock on the NSE and BSE is subject to daily price bands of 2%, 5%, 10%, or 20%, depending on its category and liquidity. These are designed to restrict excessive price fluctuations in individual stocks. Also Read: What is Long Buildup in Options Trading: A Strategic Guide to Profitable Trades Why Circuit Breakers Are Important Circuit breakers in Indian stock markets offer multiple benefits: Impact on Different Market Participants Understanding circuit breakers is essential for every type of investor or trader: Real Example: Circuit Breaker Triggered in 2020 On March 13, 2020, amid the global COVID-19 panic, the Sensex fell over 10% minutes after the opening bell. This triggered a 45-minute trading halt, offering markets a breather. Post-resumption, sentiment stabilized—highlighting the effectiveness of circuit breakers in preventing full-blown crashes. Conclusion Circuit breakers function as the emergency brakes of the Indian stock market. Though they may momentarily pause price discovery, their role in safeguarding investor interests and maintaining market stability cannot be overstated. As volatility increases in global markets, these mechanisms are becoming more critical than ever. Whether you’re a beginner or an advanced trader, understanding the SEBI circuit breaker rules is vital for developing a resilient trading strategy.

What-is-Long-Buildup
Blog

What is Long Buildup in Options Trading: A Strategic Guide to Profitable Trades

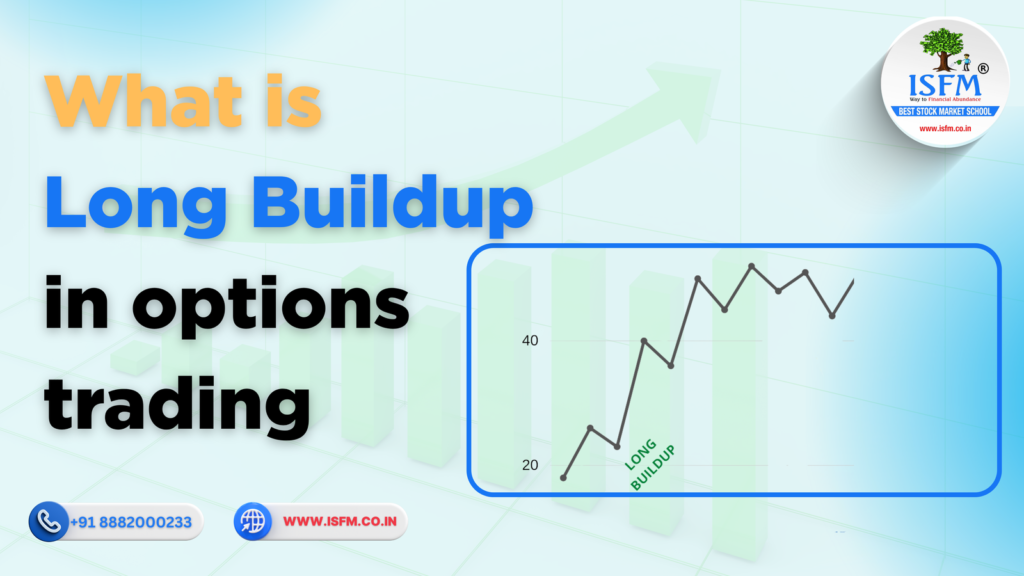
In the fast-paced world of options trading, one powerful concept stands out for identifying bullish momentum—long buildup. This occurs when both open interest (OI) and prices rise simultaneously, signaling strong buying interest and growing market optimism. Whether you’re just stepping into the market or already navigating it like a pro, decoding long buildup patterns can help you make better entry decisions and amplify returns. What is a Long Buildup in Options? A long buildup represents bullish sentiment in the market and is characterized by: This pattern often suggests institutional buying or trend-following behavior from retail traders—both positive signs for continued gains. 🔍 Compare with Short Covering: In short covering, price increases but OI falls, showing that traders are exiting bearish bets, not initiating bullish ones. Why Long Buildup Matters for Traders 1. Gauges Real Bullish Sentiment A long buildup signals genuine buying pressure, helping traders avoid fake breakouts and speculative traps. 2. Early Entry to Breakouts Long buildups often precede strong uptrends, offering early signals for options and futures trading. 3. Enhances Liquidity & Execution High OI improves trade execution quality and narrows bid-ask spreads, especially for liquid stocks or indices. 4. Informs Smarter Risk Management Understanding buildup zones helps traders set better stop-loss levels and manage exposure based on sentiment rather than just price action. How to Profit from Long Buildup in Options Trading 1. Trade the Momentum 2. Monitor Exit Signals 3. Combine with Technical Indicators 4. Apply Strict Risk Rules Step-by-Step: How to Analyze Long Buildup Step 1: Track OI & Price Data Together Use reliable platforms like: Step 2: Identify Long Buildup Signals Step 3: Analyze Option Chain Activity Look for: Also Read: What is Short Build Up? Example: If Stock ABC moves from ₹950 to ₹1,050, and call option OI at the ₹1,000 strike rises by 40%, it’s a strong long buildup indication, hinting at potential upside continuation. Common Mistakes to Avoid Conclusion: Make Long Buildup Your Edge Long buildup isn’t just a buzzword—it’s a data-backed signal that offers a clear edge in trading. When paired with smart analysis, technical indicators, and disciplined execution, it empowers traders to spot profitable trades before the crowd jumps in.

what is india vix
Blog

What is India VIX? How Market Volatility Becomes a Trader’s Ally

In the dynamic world of stock trading, volatility is more than just market noise—it’s where seasoned traders find hidden opportunities. The India VIX (Volatility Index), often referred to as the “Fear Gauge,” plays a pivotal role in decoding market sentiment. In this guide, we’ll break down what India VIX is, why it matters, its unique features, and how smart traders use it to their advantage. What is India VIX? The India VIX, developed by the National Stock Exchange (NSE), is a real-time indicator that reflects expected volatility in the market over the next 30 days. It is derived from Nifty 50 options and gives investors a glimpse into the market’s mood—whether calm, cautious, or fearful. Why India VIX Matters to Traders 1. Market Sentiment Barometer India VIX acts as an emotional compass for the markets. Sudden spikes often align with major news events like elections, policy shifts, or geopolitical crises. Example: During the COVID-19 crash in March 2020, India VIX skyrocketed to 83.6, highlighting extreme panic in the markets. 2. Risk Management Tool Both institutional and retail traders monitor VIX trends to adjust portfolio exposure and define entry/exit strategies. 3. Impact on Derivatives Pricing Higher VIX directly influences options premiums, making them more expensive due to higher implied volatility. 4. Policy Reaction Tracker Central bank announcements and regulatory changes often cause VIX movements, giving early signs of potential market reactions. Also Read: Mastering Options Chain Analysis: A Pro Trader’s Blueprint for Profits Key Features of India VIX ➤ Real-Time Volatility Tracking India VIX is calculated using the Black-Scholes model, based on real-time Nifty options bid-ask quotes. ➤ Mean-Reverting Behavior Historically, India VIX tends to revert to its average range of 15–20, offering cyclic trading setups. ➤ Inverse Relationship with Nifty 50 When the Nifty 50 index declines, VIX usually climbs—indicating fear-driven selling. ➤ Tradable via VIX Futures Since 2020, VIX futures on NSE have enabled direct participation in volatility. ➤ Global Comparability India VIX is modeled on the CBOE VIX (US), making it intuitive for global investors. How to Trade Volatility with India VIX While the index itself isn’t directly tradable, traders use VIX-related products and strategies to make profits from market fluctuations. 1. Trading VIX Futures 📊 Example: If India VIX is at 12 and a major event is approaching, a trader might go long expecting a volatility spike. 2. Deploying Options Strategies 3. Portfolio Hedging Investors can buy put options on Nifty when VIX rises to shield against downturns. 4. Event-Based Scalping Trade VIX futures during high-impact events like RBI policy meetings, Union Budgets, or global economic announcements. 5. Pairs Trading Use a combination of Nifty and VIX futures—go long on Nifty and short on VIX in stable markets. Risks Associated with VIX Trading Conclusion: Make Volatility Your Trading Edge The India VIX is more than just a volatility index—it’s a lens into the collective psychology of market participants. Whether you’re hedging your portfolio or making short-term trades, understanding and analyzing the India VIX can give you an edge in turbulent times.

top 10 etfs
Blog

Top 10 ETFs in the Indian Stock Market (2025): Features, Benefits, Drawbacks & Profit Tactics

What Are ETFs and Why Are They Trending in India? Exchange-Traded Funds (ETFs) are investment funds traded like stocks on the exchange. They offer a basket of assets—like indices, commodities, or sectors—at a fraction of the cost of mutual funds. With low expense ratios, daily liquidity, and transparent holdings, ETFs are fast becoming a favorite among Indian passive investors. Why Indian Investors Prefer ETFs Top 10 ETFs in India for 2025 Here’s a list of the best ETFs in India, curated based on AUM, returns, and investor popularity: 1. Nippon India ETF Nifty 50 BeES 2. SBI ETF Nifty 50 3. HDFC Sensex ETF 4. ICICI Prudential Nifty ETF Also Read: Top 10 Cryptocurrencies: Features, Trading Tips, Pros & Cons 5. Axis Gold ETF 6. Kotak Gold ETF 7. Mirae Asset Nifty Bank ETF 8. Bharat Bond ETF 9. Motilal Oswal NASDAQ 100 ETF 10. CPSE ETF Pros and Cons of ETF Investing in India Pros: Cons: Top Strategies to Make Money Using ETFs Conclusion: Are ETFs Right for You? ETFs offer Indian investors a simple, low-cost, and tax-efficient way to gain market exposure. Whether you’re a beginner looking for index-based ETFs or an experienced investor exploring international or sectoral plays, there’s an ETF for every goal. Start with liquid, low-cost funds and explore niche options as you gain confidence.

B-77 Top 10 crypto currencies in the world
Blog

Top 10 Cryptocurrencies: Features, Trading Tips, Pros & Cons

Cryptocurrency has transformed from a niche concept to a trillion-dollar financial ecosystem., digital assets continue to attract investors, developers, and institutions alike. Whether you’re new to crypto or a seasoned trader, understanding the top-performing cryptocurrencies can help you make smarter investment choices. This guide highlights the top 10 cryptocurrencies, their key features, trading strategies, and pros and cons, helping you stay ahead in the evolving crypto landscape. 1. Bitcoin (BTC) Key Features: How to Trade:Trade BTC on platforms like Coinbase, Binance, or Kraken. Long-term investors often follow a HODLing strategy due to its store-of-value potential. Pros: Cons: 2. Ethereum (ETH) Key Features: How to Trade:Use platforms like Binance, Gemini, or DEXs like Uniswap. You can also stake ETH on platforms like Lido Finance. Pros: Cons: 3. Binance Coin (BNB) Key Features: How to Trade:Buy BNB on Binance. Use it to reduce trading fees or participate in token sales via Binance Launchpad. Pros: Cons: 4. Tether (USDT) Key Features: How to Trade:Trade USDT on exchanges like Bitfinex, OKX, or use it to hedge against volatility. Pros: Cons: 5. Solana (SOL) Key Features: How to Trade:Buy SOL on Coinbase, Kraken, or use Phantom Wallet for DeFi and NFTs. Pros: Cons: 6. Ripple (XRP) Key Features: How to Trade:Trade XRP on platforms like Bitstamp or eToro. Keep an eye on developments in the SEC lawsuit. Pros: Cons: 7. Cardano (ADA) Key Features: How to Trade:Stake ADA via Daedalus Wallet or trade on Kraken and Binance. Pros: Cons: 8. Dogecoin (DOGE) Key Features: How to Trade:Buy DOGE on Robinhood, Binance, or follow social media sentiment for momentum trading. Also read: What is Dabba Trading: Features, Risks & Why You Should Avoid It Pros: Cons: 9. Avalanche (AVAX) Key Features: How to Trade:Buy AVAX on Coinbase or stake via Core Wallet. Try DeFi protocols like Trader Joe. Pros: Cons: 10. Polkadot (DOT) Key Features: How to Trade:Stake DOT on Kraken or trade on Binance. Join parachain auctions for governance rewards. Pros: Cons: Conclusion From Bitcoin’s dominance to Solana’s high-speed capabilities, 2023 showcases a diverse crypto ecosystem. However, the market’s volatility and regulatory developments highlight the importance of due diligence. Diversify your investments, stay updated, and always use secure wallets.Top 10 Cryptocurrencies: Features, Trading Tips, Pros & ConsFrom Bitcoin’s dominance to Solana’s high-speed capabilities, 2023 showcases a diverse crypto ecosystem. However, the market’s volatility and regulatory developments highlight the importance of due diligence. Diversify your investments, stay updated, and always use secure wallets. Final Trading Tips

What is Dabba trading
Blog

What is Dabba Trading: Features, Risks & Why You Should Avoid It

Operating beneath the surface of legitimate financial markets, Dabba trading is an illicit form of trading that bypasses regulated stock exchanges. Especially common in India, this underground practice attracts participants with the promise of lower costs and anonymity—but at what cost? This article delves into the nature of Dabba trading, its key characteristics, risks, and the impact it has on market integrity. What is Dabba Trading? The term “dabba” translates to “box” in Hindi, symbolizing the off-the-books nature of this activity. In Dabba trading, transactions are executed outside the purview of recognized stock exchanges like the NSE or BSE. Instead of routing trades through formal platforms, operators—often posing as brokers—record deals privately and settle in cash. These transactions escape regulatory surveillance and tax obligations, making them attractive but extremely risky. Key Characteristics of Dabba Trading Why Does Dabba Trading Still Exist? Despite being illegal, Dabba trading continues to thrive due to: Who Suffers from Dabba Trading? Is Dabba Trading Worth the Risk? While Dabba trading may initially seem attractive due to fewer entry barriers and low costs, it presents significant downsides: It’s always safer to trade through SEBI-registered brokers for protection and legal redress. Conclusion: Choose Legal and Transparent Trading Dabba trading is a risky shortcut that endangers your financial security and legal standing. While the allure of anonymity and low costs may seem tempting, the downsides are steep—from legal penalties to total loss of capital. For safe and long-term success in the stock market, always trade through recognized stock exchanges in India and with SEBI-authorized intermediaries Frequently Asked Questions (FAQs) Q1. Is Dabba trading legal in India? No. It is a criminal offense under the SEBI Act, Indian Penal Code, and other financial laws. Q2. How does SEBI act against Dabba trading? SEBI conducts raids, imposes penalties, and runs public awareness campaigns to deter participation. Q3. Can I recover money lost in Dabba trading? Highly unlikely. Since these trades lack legal recognition, there’s no formal dispute resolution.

how to read option chain
Blog

Mastering Options Chain Analysis: A Pro Trader’s Blueprint for Profits

In the ever-evolving world of the stock market, options trading has emerged as a high-potential avenue for savvy investors. But to truly harness its power, one must understand the options chain—a foundational yet often overlooked tool. In this guide, we’ll break down how to interpret an options chain, why it matters, and how top traders use it to unlock consistent profits. What is an Options Chain? An options chain (also known as an option matrix) is a real-time list that displays all available call and put options for a particular stock or index. It includes key data such as: Think of it as a dashboard that traders use to evaluate market sentiment, volatility, and trading opportunities. Why Options Chain Analysis is Crucial for Smart Traders Analyzing the options chain gives traders a strategic edge. Here’s why it matters: Step-by-Step: How to Read an Options Chain Example: If Reliance is trading at ₹2,400, and the ₹2,450 call has high open interest with rising IV, traders may expect an upside move. Becoming a Pro in Options Chain Analysis To truly master the art, consider these steps: Also Read: What is short covering? Risk Management Essentials: Common Mistakes Traders Should Avoid Final Thoughts Reading the options chain is more than just scanning numbers—it’s about interpreting the market’s language. With practice, you can predict potential price movements, manage risks better, and align your strategies for consistent profits.

Scroll to Top