In technical analysis, few patterns signal a strong bullish continuation like the Cup and Handle pattern. First identified by William O’Neil, this chart formation resembles a teacup and often precedes powerful price breakouts after a phase of consolidation.
For traders in the Indian stock market—whether tracking NSE or BSE stocks like Reliance, HDFC Bank, or Infosys—this pattern can be highly effective in identifying high-probability setups.
The strength of the Cup and Handle lies in its simplicity and reliability when combined with volume and trend confirmation. This guide explains what it is and how to identify it in real market conditions.
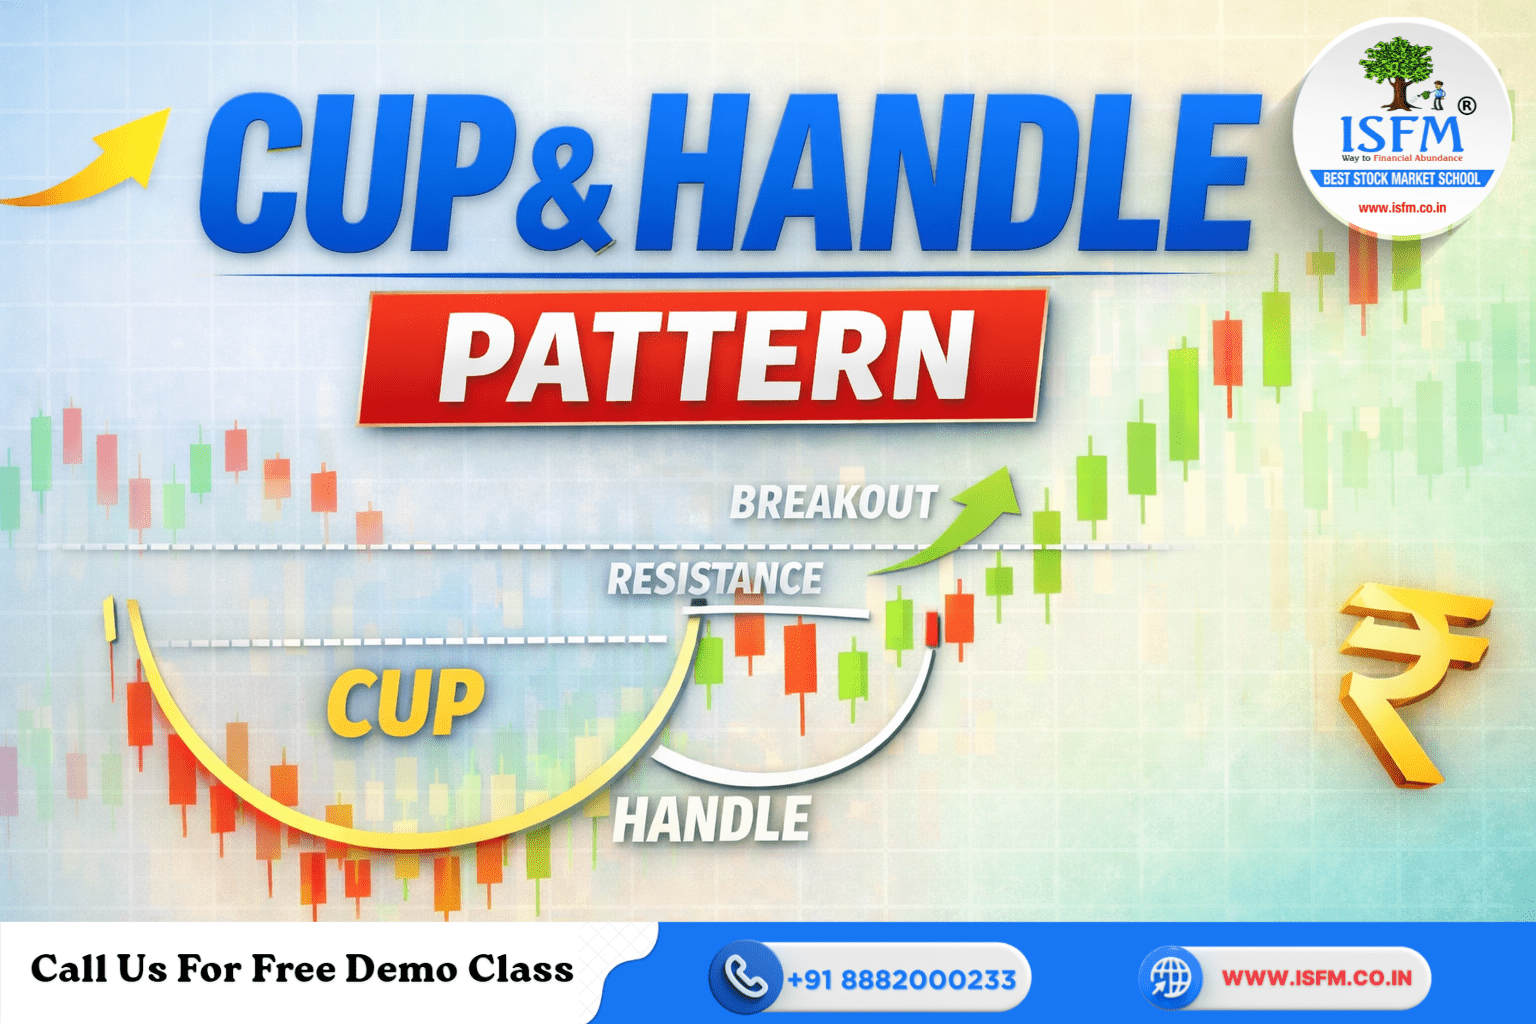
What is the Cup and Handle Pattern?
The Cup and Handle pattern is a bullish continuation pattern that forms after an uptrend and signals a potential breakout to higher levels.
Structure of the Pattern
Cup Formation
- A rounded U-shaped structure (not a sharp V)
- Forms over 1 to 6 months
- Represents a gradual shift from selling pressure to accumulation
- Depth typically ranges between 30% to 50%
Handle Formation
- A short consolidation phase (1–4 weeks)
- Slight downward or sideways movement
- Should not retrace more than one-third of the cup’s depth
Volume Behavior
- Volume declines during the cup formation
- Remains low during the handle
- Spikes sharply during breakout
This pattern reflects institutional accumulation before a strong upward move and works effectively across stocks and indices.
To understand such price behavior deeply, traders often rely on structured learning like a technical analysis course.
How to Spot the Cup and Handle Step-by-Step
1. Check the Prior Trend
- The pattern must form after a clear uptrend
- Avoid stocks in a downtrend
2. Identify the Cup
- Look for a smooth rounded structure
- Duration: Minimum 7 weeks
- Ideal depth: 12% to 33%
Avoid:
- Very shallow cups (<12%)
- Very deep cups (>50%)
3. Confirm the Handle
- Forms near the top-right of the cup
- Should stay above midpoint
- Low volume consolidation
4. Watch for Breakout
- Price breaks above resistance (cup rim)
- Must be supported by strong volume
This is the ideal entry zone for momentum traders.
5. Validate with Indicators
- RSI above 50
- Overall market trend bullish (Nifty direction matters)
- Strong support zones
Advanced traders combine such setups with strategies from an options trading course for better execution.
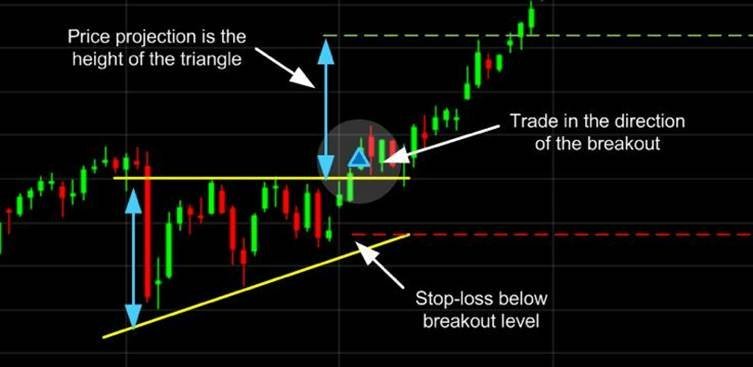
Trading Strategy: Entry, Target, Stop-Loss
Entry: Above breakout level
- Target: Cup depth added to breakout point
- Stop-Loss: Below handle low
Example
- Cup High: ₹100
- Cup Low: ₹70 → Depth = ₹30
- Breakout: ₹95
- Target: ₹125
Risk Management
- Risk only 1–2% per trade
- Avoid over-leveraging
- Follow strict stop-loss discipline
Proper risk management is a core part of any stock market course.
Common Mistakes to Avoid
- Entering without volume confirmation
- Trading V-shaped recoveries
- Accepting deep handles (>50%)
- Ignoring broader market trend
In Indian markets, where volatility can increase rapidly, discipline is critical.
Conclusion
The Cup and Handle pattern is one of the most reliable bullish continuation patterns in technical analysis. When identified correctly, it provides high-probability breakout opportunities with defined risk and reward.
Success with this pattern comes from practice—studying charts, backtesting setups, and combining them with indicators for confirmation.
Final Note
The Cup and Handle is not just a pattern—it is a reflection of market psychology and accumulation.
With the right knowledge and discipline, it can become a powerful tool in your trading system.
If you found this blog helpful, read our next article: Top 5 Bullish Candlestick Patterns to spot Winning stocks in 2026