
In 2025, a hyped microcap within the NIFTY Smallcap 100 surged nearly 50% in a short span, driven by aggressive retail participation and momentum chasing. What followed was a sharp 25% decline after a brief consolidation phase—an example of institutional distribution.
In the current 2026 correction phase, identifying such traps is critical. The bearish pennant pattern is a high-probability continuation setup that helps traders anticipate further downside and avoid being caught on the wrong side of the market.
To understand such price action setups deeply, traders often rely on structured learning through a technical analysis course.
What is a Bearish Pennant Pattern?
A bearish pennant is a continuation pattern that forms after a strong downtrend, indicating that the price is likely to continue falling after a brief consolidation.
Structure Overview:
- Sharp decline → Consolidation → Breakdown → Further decline
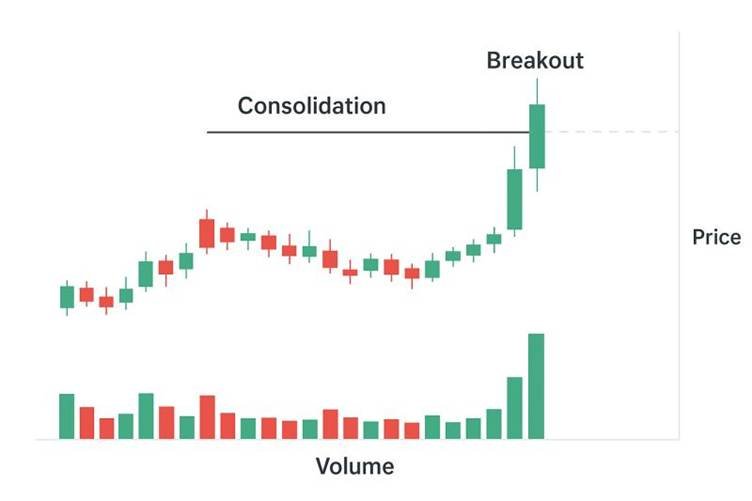
Visual Structure of Bearish Pennant

Key Components
1. Flagpole (Initial Selling Phase)
- A sharp decline of 12–25%
- Occurs within 3–7 sessions
- Volume expands to 2–3x average
- Represents strong institutional selling
2. Pennant (Consolidation Phase)
- Forms a small symmetrical triangle
- Duration: 1–3 weeks
- Price range contracts to 5–15%
- Volume declines significantly
This phase often misleads traders into believing the stock is stabilizing, while in reality, distribution continues quietly.
3. Breakdown (Continuation Move)
- Price closes below the lower trendline
- Volume expands again
- Confirms continuation of the downtrend
Target Calculation Formula
[{Target} = {Breakdown Price} – {Pole Height}]
This formula is widely used in technical analysis training to project downside targets after breakdown.
Volume Behavior (Critical Confirmation)
Volume Checklist
- High volume during the initial fall
- Declining volume during consolidation
- High volume on breakdown
If volume increases during consolidation, the reliability of the pattern decreases.
Why It Works Best in Small Caps
Small cap stocks enhance the effectiveness of bearish pennant patterns due to structural factors:
- Thin order books allow institutional distribution
- Higher beta leads to sharper moves
- Retail-driven rallies create emotional buying
Confirmation Indicators
- RSI divergence
- Negative MACD histogram
- Falling Accumulation/Distribution line
These indicators are core tools taught in stock trading courses for improving accuracy.
Step-by-Step Identification Guide
Scanner-Based Approach
1.) Stock Selection
- 5-day return below -10%
- Volume above 2x average
2.) Validate Flagpole
- Minimum 15% decline
- Strong directional move
3.) Draw Pennant
- Connect lower highs and higher lows
- Limit to 21 candles
4.) Analyze Volume
- Must contract during consolidation
5.) Wait for Breakdown
- Confirm closing below support
- Volume expansion required
Disciplined execution and screening methods are key skills developed in structured programs like the Chartered Financial Market Expert course.
Realistic Indian Market Examples
Example 1: Microcap (2025 Scenario)
- Rally: ₹45 to ₹65
- Flagpole: Drop to ₹52
- Pennant: ₹50–₹54
- Breakdown target: ₹39
Example 2: Infrastructure Small Cap (2024)
- Fall: ₹120 to ₹98
- Pennant: ₹96–₹102
- Breakdown: Target near ₹80
Example 3: Auto Ancillary Stock (2026)
- Sector-driven rally followed by decline
- Pennant formation attracted buyers
- Breakdown led to fresh lows
Average decline observed: ~18% post-breakdown.
Professional Trading Framework
Entry and Exit Rules
- Entry: On confirmed breakdown close
- Stop Loss: Above pennant high
- Target: Pole height projection
- Position Size: Risk 0.5–1% capital
Trade Management
- Limit exposure to 2–3 positions
- Trail stop loss
- Exit on reversal signals
Risk management frameworks like these are deeply covered in the advanced derivatives course.
Risks and Limitations
- False breakouts in sideways markets
- Low volatility reduces effectiveness
- News events can invalidate setups
Action Plan for Traders
- Scan small caps daily
- Focus on structure and volume
- Avoid anticipatory entries
- Maintain a watchlist
Final Insight
The bearish pennant pattern reflects a phase where institutional selling continues beneath apparent price stability. Recognizing this allows traders to align with trend direction and avoid retail traps.
To consistently identify such high-probability setups, developing strong chart-reading skills through a technical analysis course is essential.
If you found this blog helpful, you may also like Bear Put Spread Option Trading Strategy