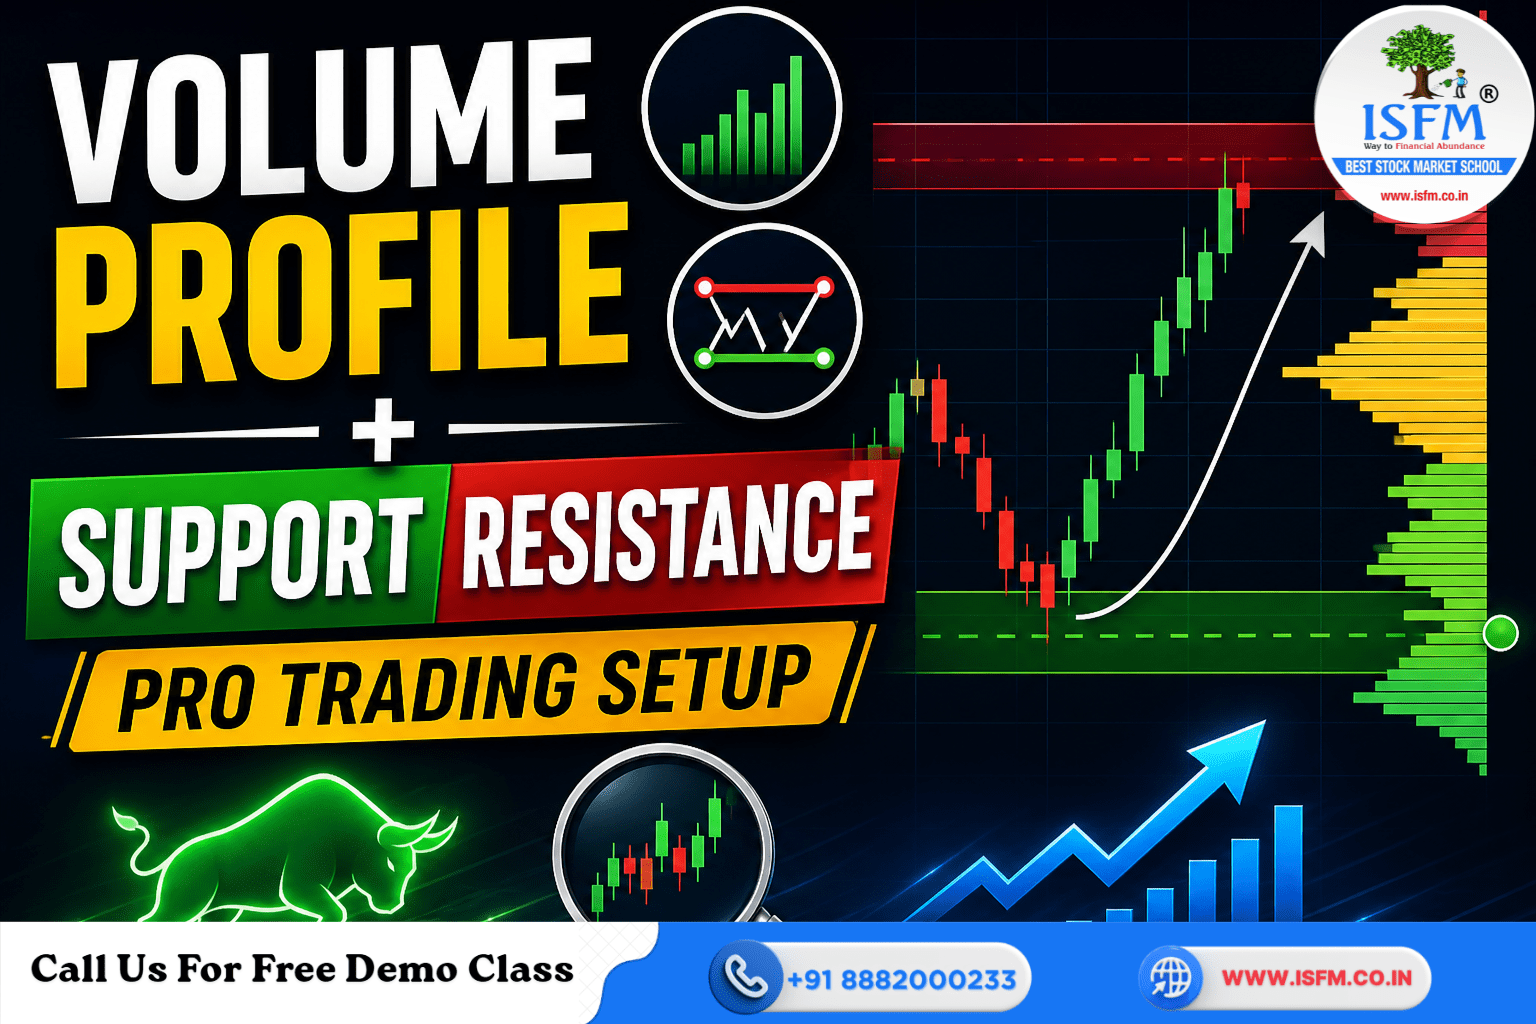
In today’s fast-moving Indian stock market, precision matters more than prediction. Successful traders don’t rely on guesswork—they use data-backed tools like Volume Profile and Support & Resistance.
When combined, these tools create a high-probability trading framework that helps identify:
- Strong demand and supply zones
- Institutional activity levels
- High-confidence entry and exit points
If you want to master such setups professionally, structured learning through a stock trading course can accelerate your journey.
What is Volume Profile?
Volume Profile is an advanced charting tool that shows trading volume at specific price levels, rather than time.
Key Components
- POC (Point of Control)
- VAH (Value Area High)
- VAL (Value Area Low)
- HVN (High Volume Node)
- LVN (Low Volume Node)
Practical Insight
If price approaches POC, expect:
- Consolidation
- Rejection
- Multiple retests
Support & Resistance: Core Market Structure


Support and resistance represent psychological price zones where buyers and sellers dominate.
Understanding the Levels
Support → Previous lows, demand zones
- Resistance → Previous highs, supply zones
- Breakouts → Valid with strong volume
- Role Reversal → Key professional concept
These foundational concepts are part of technical analysis training programs used by serious traders.
The Real Edge: Confluence Trading
A single indicator is not enough.
High-probability trades come from confluence, where:
- Volume Profile levels
- Support/Resistance zones
…align at the same price.
This is where smart money operates.
Step-by-Step Pro Trading Setup
1. Identify Key Zones
- Apply Volume Profile
- Mark POC, VAH, VAL
- Draw higher timeframe levels
2. Wait for Confluence
Example:
- Support = 24,200
- POC = 24,210
This creates a high-probability zone.
3. Observe Price Action

Look for:
- Strong rejection wicks
- Bullish/bearish candles
- Volume expansion
Avoid sideways markets.
4. Entry Rules
| Trade Type | Entry Condition | Stop Loss | Target |
| Buy | VAL hold + bullish candle | Below VAL | VAH |
| Sell | VAH reject + bearish candle | Above VAH | VAL |
5. Risk Management
- Risk only 1% per trade
- Maintain 1:2 risk-reward
- Avoid low-volume sessions
Real Market Example (Nifty Intraday)

- POC: 24,150
- Support: 24,140
- Bullish reaction + volume spike
Trade Example:
- Entry: 24,160
- SL: 24,130
- Target: 24,250
A structured, rule-based trade.
Advanced Tips for Traders
Options Strategy Integration
- VAL → Bullish setups (Bull Call Spread)
- VAH → Bearish setups (Bear Call Spread)
To implement such strategies effectively, traders rely on options trading and derivatives courses.
Avoid Common Mistakes
- Trading without volume confirmation
- Ignoring higher timeframe
- Entering during news volatility
Combine with Indicators
- RSI (divergence)
- Moving averages (trend direction)
Performance Expectation
- Beginners: 50–55% accuracy
- Skilled traders: 65–75% accuracy
Consistency = Discipline + System.
Conclusion
Volume Profile + Support & Resistance creates a powerful institutional-level trading strategy.
It helps you:
- Identify strong zones
- Avoid fake breakouts
- Improve precision
- Maximize risk-reward
If you found this blog helpful, You might also like: Evolution of India’s buyback tax rules 2024-2026