
Author name: Mr. Sushil Alewa

Sushil Alewa is the Founder & Director of ISFM – International School of Financial Market, established in July 2014 with the aim of bridging the gap between academic finance and real, practical market participation. A Certified Financial Planner - CFP from US (Reg. No. IN 51734) and SEBI Registered Research Analyst (Reg. No. INH100009433) with an MBA in finance, Sushil has spent more than 16 years in the Indian capital markets. His career spans equity advisory and research at Sharekhan, India Infoline, Indiabulls and Religare, followed by HNI portfolio advisory at Anand Rathi Wealth Management — experience that shaped the practitioner-first approach ISFM is known for today. He is an active trader and researcher, and his teaching draws directly from live market work rather than theory alone. His areas of focus include technical analysis, derivatives and options strategies, equity research and fundamental analysis, and investor awareness. Sushil is currently a PhD scholar researching options trading strategies, and regularly conducts investor awareness and financial literacy programs for students, professionals and corporate audiences.

Can Technical Analysis Predict the Stock Market in 2026
Blog

Can Technical Analysis Predict the Stock Market? Myth vs Reality (2026 Guide)

If charts could predict every stock market move, would anyone ever lose money? Obviously not. The stock market is influenced by news, investor psychology, economic conditions, global events, liquidity, and changing expectations. So, can technical analysis predict the stock market? The honest answer is no—not with certainty. Technical analysis helps traders study price, volume, trends, momentum, and market behaviour to identify probabilities and plan trades. It is a decision-making framework, not a crystal ball. According to Sushil Alewa, SEBI Registered Research Analyst (INH100009433), technical analysis should be viewed as a structured approach to analysing market behaviour and probabilities rather than a guaranteed method of predicting future prices. For readers who want to build a stronger foundation, ISFM’s Technical Analysis Course covers chart reading, candlestick analysis, trends, indicators, price action, breakouts, and risk management. What Technical Analysis Actually Does Technical analysis can help traders: Indicators such as RSI, MACD, moving averages, and volume-based tools are calculated largely from historical market data. They can help interpret market behaviour, but they cannot guarantee the next price movement. Myth 1: Technical Analysis Predicts Every Price Move Myth: A good technical analyst can know exactly where a stock will move next. Reality: Technical analysis provides probabilities, not certainty. A breakout above resistance with strong volume may indicate bullish strength, but the breakout can still fail. Unexpected events such as policy decisions, wars, earnings surprises, regulatory changes, or sudden market news can completely change the setup. Professional traders therefore focus not only on potential profit but also on what happens if the trade goes wrong. Myth 2: Every Chart Pattern Works Patterns such as head and shoulders, double tops, double bottoms, engulfing candles, and breakouts can provide useful information. However, the same pattern can produce different outcomes depending on the trend, timeframe, volume, liquidity, volatility, and overall market environment. Reality: A pattern becomes more meaningful when it is supported by market context, clearly defined rules, and proper testing. This is particularly important when learning stock market trading because a strategy should be evaluated as a complete system rather than by looking at one successful chart pattern. Myth 3: More Indicators Mean Better Predictions A chart filled with indicators may look impressive, but more indicators do not automatically mean better analysis. Many indicators use similar price data, so several indicators giving the same signal may not represent several independent confirmations. A practical framework can be much simpler: Trend + Momentum + Volume/Volatility + Risk Management The goal is not to collect indicators. The goal is to create a strategy that can be tested and executed consistently. Myth 4: Technical Analysis Is Completely Useless This is the other extreme. Research on technical trading has produced mixed results. Some studies have found potentially useful information in certain price patterns, while other research questions whether such advantages remain consistent after transaction costs, market changes, data-mining bias, and execution difficulties. Therefore, asking “Does technical analysis work?” is less useful than asking: “Does this particular strategy have a repeatable edge in this market and timeframe after costs?” Its effectiveness depends on strategy design, market conditions, execution, costs, risk management, and discipline. How Professional Traders Use Technical Analysis Professional traders generally use technical analysis to structure decisions rather than predict every move. They may use charts to: The focus is therefore on probability and process, rather than being right on every trade. When technical analysis is combined with derivatives, traders can also apply chart-based analysis to structured options trading strategies involving option buying, selling, hedging, volatility, and risk management. Technical Analysis vs Fundamental Analysis Technical analysis and fundamental analysis answer different questions. Technical Analysis Fundamental Analysis Price and volume Earnings and financial statements Trends and momentum Business quality Support and resistance Valuation Chart patterns Debt and profitability Entry and exit timing Growth prospects Market behaviour Economic and industry factors Investors may use technical analysis to understand price behaviour and timing while using fundamental analysis to study business quality, financial performance, valuation, and growth factors. The two approaches do not necessarily have to compete with each other. How to Use Technical Analysis Realistically For beginners and intermediate traders: Technology can also assist traders in screening and organising market data. ISFM’s AI Stock Scanner is one example of a tool designed around automated stock-selection sheets. However, automated screening should not be confused with guaranteed prediction or investment advice. Avoid changing strategies after every losing trade or confusing a lucky winning streak with a genuine trading edge. FAQs Can technical analysis predict stock prices? No. Technical analysis cannot predict stock prices with certainty. It helps traders identify potential scenarios and probabilities using price, volume, trends, and market behaviour. Does technical analysis work for beginners? It can be useful for beginners when learned as a structured decision-making process. Beginners should focus on basic concepts, testing, and risk management rather than searching for guaranteed signals. Which indicator is best for predicting the stock market? There is no universally best indicator. Moving averages, RSI, MACD, volume, and volatility tools can serve different purposes. Their usefulness depends on the strategy and market conditions. Is technical analysis better than fundamental analysis? Neither is universally better. Technical analysis focuses mainly on price behaviour and timing, while fundamental analysis examines business performance, valuation, earnings, and growth. Can technical analysis guarantee profits? No. Any claim of guaranteed profits or 100% accuracy should be treated with extreme caution. Every technical setup can fail. Conclusion Technical analysis cannot predict the stock market with certainty. Its real value is helping traders organise information, identify possible scenarios, define risk, and make consistent decisions. Successful trading is not about predicting every move. It is about preparing for different outcomes and ensuring that no single trade can seriously damage your capital.


Box Arbitrage
Blog

Box Arbitrage: Risk-Free Options Profit Strategy for NSE Traders

In the world of options trading, most strategies involve some level of risk—directional, volatility, or time-based. But there exists a rare category known as true arbitrage, where profit is theoretically risk-free. For reference, you can view the original draft here: Box Arbitrage Trading Strategy The Box Arbitrage India strategy is one such powerful setup used by professional traders and institutions to exploit pricing inefficiencies in NSE options. It combines multiple option positions to lock in a guaranteed payout, regardless of market direction. According to Sushil Alewa, SEBI Registered Research Analyst (INH100009433), Box Arbitrage is an options strategy that exploits pricing differences between call and put combinations to create a predefined payoff, based on the principle of put-call parity and arbitrage opportunities. If you are new to such advanced strategies, it is recommended to first understand derivatives thoroughly through an options trading course. While the concept sounds simple, execution requires precision, speed, and deep understanding of pricing. What is Box Arbitrage Strategy? Box Arbitrage is a conversion arbitrage strategy that involves creating a “box” using two spreads: When combined correctly, the strategy ensures a fixed payoff at expiry, equal to the difference between two strike prices. If the total cost of the box is less than the guaranteed payout, the difference becomes risk-free profit. To understand spread-based strategies clearly, traders often build their base through a technical analysis course along with derivatives learning. How Box Spread Works (Bull Call + Bear Put) The structure includes four legs: 1. Bull Call Spread 2. Bear Put Spread Together, these positions create a synthetic fixed-income payoff, independent of Nifty movement. At expiry: Guaranteed Payoff = Higher Strike – Lower Strike To master such multi-leg combinations, traders often explore advanced derivatives training. Why Box Arbitrage Guarantees Profit The logic is based on options pricing parity (put-call parity). No matter where the market goes: Profit Condition: This makes it one of the few risk-free options strategies—at least theoretically. Setup: Strike Selection, Mispricing Detection, Execution To execute a box spread NSE: Key Requirement: Execution must be simultaneous to lock in arbitrage before prices adjust. Step-by-step Numerical Example (Nifty Box Arbitrage Opportunity) Let’s take a hypothetical arbitrage setup: Positions: Total Cost Calculation: Arbitrage Profit: Profit = ₹100 – ₹95 = ₹5 per lot (risk-free) (Before brokerage and taxes) No matter where Nifty expires, you will receive ₹100. When Box Arbitrage Works in Indian Markets Opportunities arise when: These inefficiencies are usually short-lived and quickly corrected by HFT algorithms and institutional traders. Key Execution Challenges and Costs While the strategy is risk-free in theory, practical execution is challenging: Major Challenges: Real-World NSE Example and Profit Calculation Consider a weekly expiry scenario: After a major event like RBI policy, markets stabilize but option premiums remain temporarily distorted. This creates a mismatch in put-call parity, leading to a box arbitrage opportunity. Professional traders and HFT systems quickly: These trades often last seconds to minutes, not hours. For traders aiming to reach this level of execution, a structured stock market course in Gurgaon can provide deeper practical insights. Quick Recap and Pro Implementation Tips Pro Tips: To build such precision and execution discipline, traders often rely on mentorship-driven programs like the Chartered Stock Trading Expert Course. Final Insight In reality, box arbitrage is a game of speed, precision, and efficiency. While theoretically risk-free, only well-equipped and highly disciplined traders can consistently capture these opportunities.

10 Financial Ratios Every Investor Must Know Before Buying a Stock
Blog

10 Financial Ratios Every Investor Must Know Before Buying a Stock (2026 Guide)

Many investors buy stocks based on tips, news, social media or short-term price movements. But before investing your money, one question matters: What do the numbers say about the company? According to Sushil Alewa, SEBI Registered Research Analyst (INH100009433), MBA and CFP, investors should look beyond market tips and understand a company’s financial strength, valuation, profitability and risk. Financial ratios make this easier by converting financial-statement numbers into simple, comparable measures. They help investors judge whether a stock looks expensive, assess business profitability, and understand debt and liquidity. If you want to learn the basics of financial markets before going deeper into analysis, explore ISFM’s Stock Market Course. 1. P/E Ratio — Price-to-Earnings Tip: Compare P/E with industry peers and the company’s historical average. 2. P/B Ratio — Price-to-Book A low P/B isn’t automatically cheap; it can also reflect poor asset quality or weak profitability. 3. PEG Ratio 4. ROE — Return on Equity 5. ROCE — Return on Capital Employed For a deeper understanding of company financials, profitability and valuation, explore ISFM’s Fundamental Analysis Course. 6. Net Profit Margin 7. Debt-to-Equity Ratio 8. Interest Coverage Ratio 9. Current Ratio 10. Quick Ratio How to Use These 10 Ratios Together Never judge a stock using just one ratio. Use a simple framework: Most importantly, examine 5–10 years of financial data, not just the latest quarter. Once you understand fundamental analysis, technical analysis can help you study price trends, support and resistance, momentum and potential entry and exit levels. Learn more through ISFM’s Technical Analysis Course. Investors interested in derivatives can also explore the Options Trading Course to understand options strategies, Greeks, volatility and risk management. For a more comprehensive learning path covering fundamental analysis, technical analysis, derivatives and other market concepts, consider ISFM’s Chartered Stock Trading Expert (CSTX) Course. Common Mistakes Investors Make Avoid these mistakes: Financial ratios should always be combined with business quality, management, competitive position, cash flows and industry conditions. Conclusion These 10 financial ratios every investor must know provide a practical framework for evaluating a company’s valuation, profitability, debt and liquidity. There is no magic ratio that guarantees a successful investment. Instead, compare the company’s numbers with its peers, historical performance and business fundamentals. Before buying a stock, ask yourself one simple question: “Do the numbers support the story?” If they do, you are investing with your eyes open—not simply following a tip.

7 Powerful Indicators Used by Professional Traders
Blog

7 Powerful Indicators Used by Professional Traders (And How to Use Them)

Author: Mr. Sushil Alewa — SEBI Registered Research Analyst, MBA, CFP & Director, ISFM Many beginners believe that more indicators mean better trading decisions. They add RSI, MACD, moving averages, Bollinger Bands and several other tools to one chart—only to end up with conflicting signals. Professional traders often take the opposite approach: use fewer tools, but understand them deeply. The following are 7 powerful indicators used by professional traders and how they can be applied in stocks, F&O, intraday and swing trading. 1. VWAP — Volume-Weighted Average Price VWAP shows the average price at which an asset has traded during the session, adjusted for volume. For intraday traders, it can provide a useful reference for intraday fair value and market bias. A simple interpretation: For example, if Nifty breaks higher, moves above VWAP and successfully holds it during a pullback, the move may have stronger confirmation. VWAP should be combined with price action rather than used alone. 2. 9 & 20 EMA The 9 EMA and 20 EMA are popular short-term trend indicators. Because EMAs give greater weight to recent prices, they respond quickly to changing market conditions. Common observations include: However, blindly trading every crossover can produce false signals. Combine EMAs with higher highs, higher lows, support, resistance and price structure. Traders looking to strengthen their chart-reading skills can explore ISFM’s Technical Analysis Course. 3. RSI — Relative Strength Index RSI is a momentum oscillator ranging from 0 to 100. It helps traders understand the strength and speed of price movements. The traditional interpretation is: But professional-style analysis goes beyond these levels. Divergence is particularly useful. If price makes a new high but RSI forms a lower high, momentum may be weakening. Similarly, strong RSI momentum accompanying a breakout can provide additional confirmation. Remember: RSI above 70 does not automatically mean sell, and RSI below 30 does not automatically mean buy. 4. MACD — Moving Average Convergence Divergence MACD is a trend-following momentum indicator based on exponential moving averages. Traders commonly study: When the histogram expands, momentum may be strengthening. When it starts contracting, momentum may be losing strength. MACD can be particularly useful on 1-hour and daily charts for swing and positional traders. For traders interested in applying technical tools to derivatives, ISFM’s Advance Derivatives Course provides deeper exposure to derivatives and trading concepts. 5. ATR — Average True Range ATR measures market volatility, not market direction. It tells traders approximately how much an instrument typically moves over a given period. This makes ATR especially valuable for risk management. Traders can use ATR for: For example, a trader may use an ATR multiple to determine an appropriate stop distance instead of placing an arbitrary stop. The key point is simple: ATR helps manage risk; it does not predict direction. 6. Volume & Relative Volume (RVOL) Price tells you what happened. Volume provides information about participation behind the move. Suppose a stock breaks an important resistance level with unusually high volume. That breakout may carry more significance than a similar move occurring on very low volume. RVOL compares current volume with normal volume and can highlight unusual market participation. Pay particular attention to volume during: Volume becomes even more valuable when combined with price structure and VWAP. 7. Market Breadth & Internals Professional index traders often look beyond the index itself. Market breadth indicators such as the Advance-Decline ratio help determine whether a larger number of stocks are participating in a market move. For example, Nifty may be rising while only a handful of large-cap stocks are responsible for the gain. Weak breadth can therefore warn traders that the rally may lack broad participation. Market internals are best used as a context filter, particularly when trading major indices. How to Combine These Indicators Without Clutter You don’t need all seven indicators on every chart. A practical framework could be: Think of each tool as having a different job: Traders interested in developing a broader professional skill set can explore ISFM’s Chartered Stock Trading Expert (CSTX) Course. For traders combining technical analysis with systematic approaches, ISFM also offers an Algo Trading Course covering algorithmic trading concepts and strategies. Options traders can further build their understanding through ISFM’s Options Trading Course. Common Mistakes Traders Make Avoid these frequent mistakes: Indicators are derived from market data. They are useful decision-support tools, not prediction machines. Conclusion: Build a Toolkit, Not a Dashboard VWAP, 9/20 EMA, RSI, MACD, ATR, Volume/RVOL and market breadth can provide valuable information when used correctly. But professional trading isn’t about putting all seven indicators on one screen. Pick 2–3 indicators, learn them deeply, and combine them with price action, market structure and disciplined risk management. That’s how traders can turn indicators from chart clutter into a structured trading toolkit.

Short Calendar Spread in Options Trading
Blog

Short Calendar Spread in Options Trading: Strategy, Setup, Payoff & When to Use (2026 Guide)

Most options traders are familiar with the long calendar spread, but fewer understand its opposite: the short calendar spread, also called a reverse calendar spread or short time spread. A short calendar spread is designed for a very different market view. Instead of expecting the underlying to remain relatively stable, traders generally use it when they anticipate a large price move or a decline in far-month implied volatility (IV). In this guide, we explain the short calendar spread options strategy, its setup, payoff, risks and practical use in Indian markets. According to Sushil Alewa, SEBI Registered Research Analyst (INH100009433), understanding volatility, expiry dynamics and risk management is essential before using advanced options strategies such as the short calendar spread. What Is a Short Calendar Spread? A short calendar spread involves buying a near-month option and selling a far-month option at the same strike price and on the same underlying. Buy Near-Month Option + Sell Far-Month Option = Short Calendar Spread Because the far-month option generally carries more time value, the position is typically entered for a net credit. This is the reverse of a long calendar spread, where the trader buys the far-month option and sells the near-month option. Traders looking to build stronger options knowledge can explore the ISFM Options Trading Strategy Course, which covers option Greeks, volatility analysis and advanced strategies. How to Construct a Short Calendar Spread? There are two common versions: Short Call Calendar Spread Short Put Calendar Spread For example, a trader may buy a near-month ATM call with 25 days to expiry and sell a far-month ATM call with 55 days to expiry. When Do Traders Use a Short Calendar? The reverse calendar spread trading strategy is generally considered in two situations. 1. Expecting a Sharp Move The trader expects the stock or index to make a significant move before the near-month expiry. If the underlying moves substantially away from the strike, the values of the two options can converge, potentially allowing the trader to close the spread profitably. 2. Expecting Far-Month IV to Fall Implied volatility represents the market’s expectation of future price movement. Far-month options can be sensitive to changes in volatility. If far-month IV declines significantly, the short far-month option may lose value, potentially benefiting the spread. Short Calendar Spread Example Suppose XYZ is trading at ₹100. A trader creates a short call calendar at the ₹100 strike: If XYZ makes a sharp move toward ₹110 or ₹90 before near-month expiry, the trader may be able to close the spread at a profit depending on option prices and volatility conditions. However, if XYZ remains close to ₹100, the near-month call can lose most or all of its value while the far-month short call retains substantial time value. Payoff and Risk The short calendar spread is not a simple low-risk neutral strategy. Potential gain is generally limited to the initial credit or the amount by which the two option values converge favourably. The major risk occurs when the underlying remains near the strike. The near-month option may expire with little value while the far-month option still has significant value. If the near-month option expires and the far-month short option remains open, the trader can effectively be left with a naked short option, creating potentially large risk. Breakeven levels are dynamic because they depend on the underlying price, implied volatility and time remaining. Short Calendar vs Long Calendar Spread Feature Long Calendar Short Calendar Near-month Sell Buy Far-month Buy Sell Entry Net Debit Net Credit Market View Relatively stable Large move / volatility change Main Risk Debit paid Potentially large Volatility Focus Time spread Far-month IV movement Understanding this difference is essential when comparing a calendar spread vs reverse calendar strategy. Practical Tips for Indian Markets For traders considering options trading strategies in India: Understanding price action can also help traders develop a more structured market view. Learn more through ISFM’s Technical Analysis Course. For additional learning resources, traders can explore ISFM’s Options Trading Study Material, which includes an Options Trading Strategy resource. When Should You Avoid a Short Calendar? Avoid the strategy when you strongly expect the underlying to remain range-bound and quiet, particularly around the strike. It may also be unsuitable if you cannot monitor the position regularly or are uncomfortable with the risk created by the far-month short option. For a neutral, low-volatility view, a long calendar spread may be more appropriate. Build Broader Trading Skills A short calendar spread is only one part of advanced derivatives trading. Traders who want broader exposure to derivatives, technical analysis, risk management and trading strategies can explore ISFM’s Algo Trading Course, which includes options trading, technical analysis and risk-management concepts. Frequently Asked Questions 1. What is a short calendar spread? A short calendar spread involves buying a near-month option and selling a far-month option at the same strike price. It is also called a reverse calendar spread. 2. Is a short calendar spread bullish or bearish? It is not purely bullish or bearish. The strategy is generally associated with an expectation of a significant price move or a favourable change in implied volatility. 3. What is the biggest risk of a short calendar spread? If the underlying remains near the strike and the near-month option loses its value, the far-month short option can retain substantial value. Holding the position too close to near expiry can create significant or potentially unlimited exposure depending on the option sold. 4. Is a short calendar spread suitable for beginners? Generally, it is better suited to experienced options traders who understand Greeks, implied volatility, expiry behaviour and position management. Final Takeaway According to Sushil Alewa, SEBI Registered Research Analyst (INH100009433),The short calendar spread options strategy is an advanced strategy built around differences in expiry, price movement and implied volatility. It can be considered when a trader expects a significant move or a decline in far-month IV, but it comes with meaningful risk if the underlying remains near the strike and the position is not managed correctly. The

Technical Analysis vs Price Action: Which Trading Method Actually Works
Blog

Technical Analysis vs Price Action: Which Trading Method Actually Works? (2026 Reality Check)

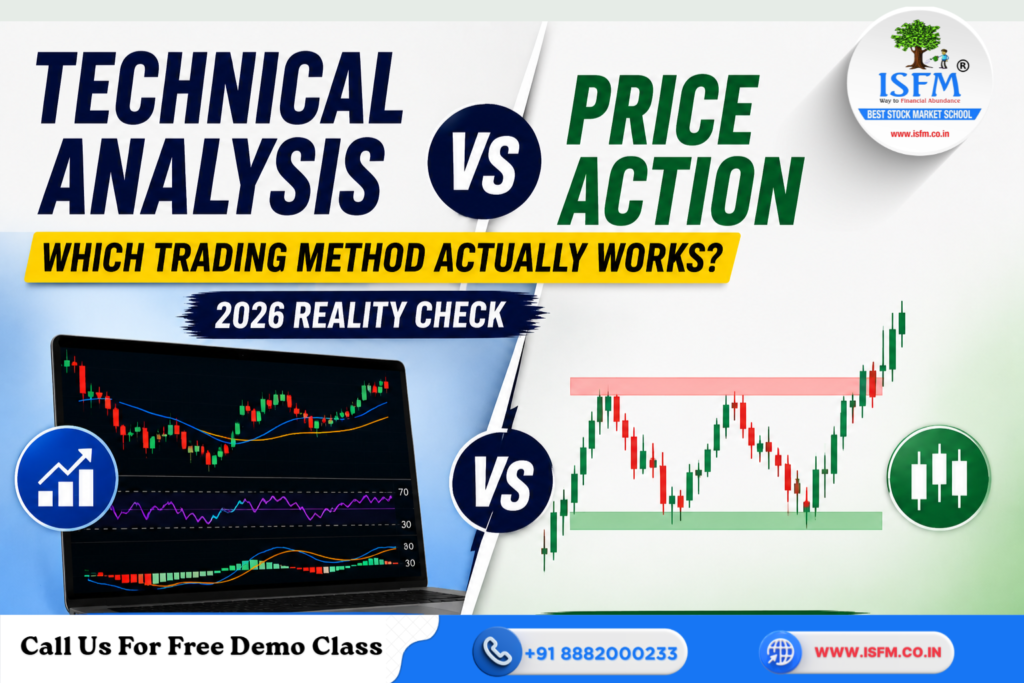
Open any trading YouTube channel or forum and you will find the same debate: “Indicators are useless—only price action works” versus “You need technical indicators to trade properly.” The reality is much more practical. Both technical analysis and price action are tools for understanding markets and making better trading decisions. The real question is not which method is magical, but which approach fits your trading style and how you use it. According to Sushil Alewa, SEBI Registered Research Analyst (INH100009433), successful trading is less about finding a perfect indicator or pattern and more about developing a repeatable process supported by discipline, risk management and continuous learning. What Is Technical Analysis? Technical analysis uses price, volume and mathematical indicators to identify market trends, momentum and potential trading opportunities. Popular indicators include: For example, a trader might use a 20 EMA and 50 EMA to identify a trend and RSI to assess momentum. Indicators can make trading rules more structured and easier to backtest. However, most indicators are calculated from historical data, meaning many signals can lag behind price. For traders who want to build a stronger foundation, explore ISFM’s Technical Analysis Course. What Is Price Action Trading? Price action trading focuses primarily on what price itself is doing rather than relying heavily on indicators. Traders study: For example, instead of waiting for an RSI signal, a price-action trader may watch how price reacts when it reaches an important support level. Price action can provide a cleaner chart and more immediate market context, but it is also more subjective. Two traders can look at the same chart and interpret it differently. Technical Analysis vs Price Action Factor Technical Analysis Price Action Main Focus Indicators + price Raw price movement Signals Rule-based Context-based Learning Easier initially Requires practice Charts More indicators Cleaner charts Subjectivity Lower Higher Backtesting Easier More difficult Best Fit Systematic traders Discretionary traders Where Technical Indicators Work Well Technical indicators can be particularly useful for trend identification, momentum confirmation and systematic trading. For example: Another advantage is that indicator-based strategies can often be converted into clear rules and backtested. The problem begins when traders put five or ten indicators on one chart. Conflicting signals can create confusion rather than clarity. Where Price Action Works Well Price action can be useful when traders want to understand market structure and behaviour around important levels. It can help traders identify: The major advantage is context. Instead of asking only what an indicator says, the trader asks: “What is price actually doing here?” The limitation is that price action requires experience. Seeing a candlestick pattern does not automatically make it a valid trade. So, Which Trading Method Works Better? The honest answer is: both can work. Neither is a guaranteed money-making system. A profitable strategy depends on much more than the method itself: A trader with an excellent indicator but poor risk management can lose money. Similarly, someone who understands price action but takes random trades can also fail. This is why many experienced traders use a hybrid approach. For example: Which Method Should Beginners Choose? Choose indicator-based technical analysis if you prefer clear rules, structured systems and eventually want to backtest or automate strategies. Choose price action if you enjoy reading charts, understanding market behaviour and making context-based decisions. A practical middle path is to use price action as the foundation and only one or two indicators as confirmation. If you are interested in combining technical analysis with derivatives strategies, you can explore ISFM’s Options Trading Strategy Course. Traders interested in systematic and automated strategies can also explore the Algo Trading Course. Common Mistakes Traders Make Indicator Traders Price Action Traders In both cases, poor risk management is often a bigger problem than the choice of method. Frequently Asked Questions 1. Is price action better than technical analysis? No method is automatically better. Price action and indicator-based technical analysis can both be useful when applied with proper risk management and a tested process. 2. Is technical analysis suitable for beginners? Yes. Indicators can provide beginners with structured rules, but traders should first understand what an indicator measures instead of blindly following signals. 3. Can I use price action and indicators together? Yes. A practical approach is to use price action for market structure and entries, while using one or two indicators for confirmation. 4. Which is better for intraday trading? Both can be used for intraday trading. The better choice depends on the trader’s experience, strategy, time frame and ability to manage risk. Final Takeaway Stop searching for the “holy grail” of trading. According to Sushil Alewa, SEBI Registered Research Analyst (INH100009433), Technical analysis and price action are simply different ways of reading the market. What matters more is whether you understand your method, can apply it consistently and have a strong risk-management framework. Don’t ask, “Which method works better?” Ask: “Which method fits my personality, trading timeframe and risk tolerance—and how can I turn it into a simple, repeatable process?” That is where a genuine trading edge begins.

Stock Broker vs Trader vs Investor
Blog

Stock Broker vs Trader vs Investor: Which Career Is Right for You? (2026 Guide)

Want to build a career in the stock market but confused whether you should become a broker, trader or investor? These three roles operate in the same financial market, but their responsibilities, skills, working styles and career paths are very different. According to Sushil Alewa, SEBI Registered Research Analyst (INH100009433), choosing a stock-market career should depend on your skills, temperament and long-term goals—not simply on how exciting the role appears from the outside. Let’s understand the difference between a stock broker vs trader vs investor and find out which path may suit you. What Does a Stock Broker Do? A stock broker acts as an intermediary between clients and the stock exchange. Brokers execute buy and sell orders and may provide market information, research or other permitted services. Their typical work includes: Brokers usually work with brokerage firms, banks or wealth-management companies. Their income can include salary, commissions and other permitted fees depending on their role and organisation. If you’re interested in building a foundation in financial markets, explore ISFM’s Stock Market Course. What Does a Trader Do? A trader focuses primarily on buying and selling financial instruments to benefit from price movements. Traders may work with: They can work for a trading firm, bank, brokerage or proprietary trading desk—or trade their own capital. Trading requires strong risk management, discipline, decision-making and emotional control. Technical analysis and derivatives knowledge can also be important depending on the trading role. For those interested in derivatives, ISFM offers an Options Trading Strategy Course. The official NISM Series VIII Equity Derivatives certification is also designed to establish a knowledge benchmark for specified associated persons working in equity derivatives. (NISM) What Does an Investor Do? An investor generally focuses on long-term wealth creation by owning assets or businesses for extended periods. Professional investors may work with: Their work involves studying companies, financial statements, industries, management quality, valuations and long-term growth potential. If you enjoy understanding businesses and analysing financial statements, ISFM’s Fundamental Analysis Course can help develop these skills. Broker vs Trader vs Investor Factor Broker Trader Investor Main Focus Clients & execution Price movements Long-term wealth Time Horizon Varies Minutes to months Years to decades Key Skill Communication Risk & decision-making Research & valuation Analysis Product + market Technical/quant Fundamental Stress Moderate–High High Moderate Income Salary + commissions Salary/bonus or P&L Salary + performance Best For People-oriented Fast decision-makers Patient researchers Which Stock Market Career Is Right for You? Choose Broker If: You enjoy talking to people, building relationships and explaining financial products. You should also be comfortable with sales targets and client interaction. Choose Trader If: You enjoy charts, fast decisions and market action and can handle losses, volatility and pressure without allowing emotions to control your decisions. Choose Investor If: You enjoy research, reading annual reports and understanding businesses. Patience and long-term thinking are essential. You don’t necessarily have to choose only one path. Many professionals start in one role and later move into research, advisory, trading, wealth management or portfolio management. Education and Certifications Common educational backgrounds include B.Com, BBA, Economics, Mathematics, Statistics, Engineering and MBA Finance. Relevant certifications depend on the role. NISM offers certifications covering areas such as equity derivatives, investment advisory and securities operations. For example, NISM Series VIII focuses on equity derivatives, while NISM Series X-A covers Investment Adviser Level 1. (NISM) You can also explore NISM Certification Training at ISFM for structured preparation. Reality Check: The Tough Side Frequently Asked Questions 1. Is a trader better than an investor? Neither is automatically better. Trading suits people comfortable with short-term decisions and risk, while investing suits those who prefer research and long-term compounding. 2. Can I become a stock broker without a finance degree? A finance degree can help, but it is not the only route. Relevant market knowledge, required certifications, regulatory requirements and practical skills are important. 3. Which career has the highest earning potential? There is no guaranteed highest-paying path. Income depends on experience, performance, organisation, client base, capital and role. 4. Which stock market career is best for beginners? For beginners, building a strong foundation in financial markets before choosing a specialisation is sensible. You can start with structured Technical Analysis training if you’re interested in trading, or fundamental analysis if you’re more interested in investing. Final Takeaway The real question isn’t “Broker vs Trader vs Investor—which is best?” It is: “Which role matches who I am?” According to Sushil Alewa, SEBI Registered Research Analyst (INH100009433),If you love people, consider broking. If you love fast decisions and price action, consider trading. If you enjoy research and patience, investing may be your path. Don’t choose a career because it looks exciting on social media. Choose the role where your natural strengths, interests and temperament match the day-to-day work.

Radhakishan Damani Success Story
Blog

Radhakishan Damani Success Story: How He Built DMart & Became a Billionaire

What if one of India’s most successful retail businesses was built not by a traditional retailer, but by a stock market investor? That is the story of Radhakishan Damani, the founder of DMart and Avenue Supermarts. Known for his low-profile personality and value-investing approach, Damani transformed himself from a stock market trader into one of India’s most successful investor-entrepreneurs. Forbes’ 2026 World’s Billionaires list placed Damani among India’s richest people, with a net worth of about $15.7 billion as of March 1, 2026. Forbes profile and 2026 billionaire information. According to Sushil Alewa, SEBI Registered Research Analyst (INH100009433), Radhakishan Damani’s journey highlights the importance of understanding a business deeply, maintaining financial discipline and allowing long-term compounding to work rather than chasing short-term market trends. This Radhakishan Damani success story is not simply about becoming rich. It is about patience, research, cost control and building businesses that can compound over time. Early Life and Entry into the Stock Market Damani grew up in Mumbai in a Marwari business family. His father was associated with the stock market, but Damani initially explored business outside the markets. He studied commerce at the University of Mumbai but dropped out after his first year and started a ball-bearing business. After his father’s death, he entered the stock market and eventually became a stockbroker and investor. His early market experience taught him an important lesson: price and value are not always the same thing. For investors who want to develop a structured approach to evaluating companies, learning Fundamental Analysis can provide a strong foundation. From Trader to Value Investor During the Harshad Mehta era of the early 1990s, Damani became known for taking bearish positions against stocks he believed were excessively valued. When the market bubble collapsed, his short-selling positions reportedly generated substantial profits. But his biggest transformation came later. Instead of remaining primarily a trader, Damani increasingly focused on long-term investments in quality businesses. His investment interests included companies such as VST Industries, CRISIL, HDFC Bank and Gillette India. He became known for studying businesses carefully, looking for reasonable valuations and having the patience to hold investments for years. This philosophy is closely connected with the principles taught in ISFM’s Stock Market Course, where investors can develop broader knowledge of markets, investment concepts and trading. The Idea Behind DMart Damani eventually moved from simply owning businesses to building one himself. In 1999, he operated an Apna Bazaar franchise in Nerul. The experience helped him understand retail operations and gave him practical exposure to the challenges of the retail business. In 2002, he launched the first DMart store in Powai, Mumbai, through Avenue Supermarts. The idea was straightforward: Offer everyday products at attractive prices while keeping the business operationally efficient. How DMart Built Its Competitive Advantage DMart’s business model focuses heavily on value retailing and cost efficiency. Several elements became important: Unlike the popular perception that every DMart store is owned outright, the company uses a combination of owned and leased properties. This illustrates an important lesson: DMart’s advantage is not one trick—it is a combination of financial discipline, operations and execution. The 2017 IPO A major milestone came in March 2017, when Avenue Supermarts completed its IPO and the shares were listed on the BSE and NSE. The IPO attracted enormous investor interest and helped establish Damani as one of India’s most prominent billionaire entrepreneurs. For anyone studying how businesses move from private ownership to public markets, understanding Fundamental Analysis and IPO investing can be particularly useful. Radhakishan Damani’s Investment Philosophy His journey offers several principles that investors can understand: 1. Focus on Value, Not Hype Don’t buy a business simply because everyone is talking about it. Understand what the business actually earns and what can drive its future growth. 2. Think Long Term Damani’s career demonstrates the power of patience. Quality businesses need time to grow, and investors need time to benefit from that growth. 3. Understand the Business Before building DMart, Damani gained practical exposure to retail. His investment approach has similarly been associated with understanding businesses rather than blindly following market trends. 4. Control Costs DMart’s success demonstrates that a strong business does not always need the highest prices. Operational efficiency can become a major competitive advantage. 5. Let Results Speak Damani is famously low-profile and rarely seeks the spotlight. His approach has largely focused on execution rather than publicity. What Investors and Entrepreneurs Can Learn The biggest lesson from the Radhakishan Damani success story is that extraordinary results often come from ordinary principles applied consistently. And perhaps most importantly, don’t confuse a successful person’s portfolio with their real advantage. The valuable thing to copy is the process, not the portfolio. Investors who want to combine business analysis with price and market behaviour can also explore ISFM’s Technical Analysis Course. Challenges Ahead for DMart The Indian retail industry is becoming increasingly competitive. Traditional retailers face competition from large organised chains as well as quick-commerce platforms. Companies such as Reliance Retail, Tata and emerging digital platforms are changing how Indian consumers shop. For DMart, the challenge will be to maintain its cost advantage and customer value proposition while adapting to changing consumer expectations. This is another lesson entrepreneurs can learn from Damani: a successful business model must continue evolving without losing its core strengths. Final Takeaway Radhakishan Damani’s journey from stock market trader to the founder of one of India’s leading retail chains is a powerful example of how investing and entrepreneurship can reinforce each other. According to Sushil Alewa, SEBI Registered Research Analyst (INH100009433) DMart’s growth demonstrates the importance of understanding customers, controlling costs, maintaining financial discipline and thinking long term. The real takeaway from Damani is not “find the next DMart.” It is much simpler: Study deeply. Buy value. Control costs. Stay patient. Let compounding do the heavy lifting. If you want to develop broader skills in financial markets, options and trading strategies, you can also explore ISFM’s Options Trading Strategy Course.

How to Analyze a Stock Before Investing
Blog

How to Analyze a Stock Before Investing? A Complete Fundamental Analysis Guide (2026)

Buying a stock because of a social-media tip, news headline or someone else’s recommendation can be risky. Before investing, it is important to understand what the company does, how financially strong it is, and whether its valuation makes sense. According to Sushil Alewa, SEBI Registered Research Analyst (INH100009433), fundamental analysis helps investors move beyond market noise and develop a structured view of a company’s business, financial strength, valuation and long-term prospects. This guide explains how to analyze a stock before investing using a simple, step-by-step framework. What Is Fundamental Analysis? Fundamental analysis evaluates a company’s business, financial statements, industry, management and valuation to understand its underlying value. Unlike technical analysis, which focuses mainly on price, volume and charts, fundamental analysis focuses on the business behind the stock. SEBI Investor also explains fundamental analysis in terms of financial health, business performance, industry factors and valuation metrics. You can learn more through ISFM’s Fundamental Analysis Course. Step 1: Understand the Business Before looking at ratios, understand what the company actually does. Ask: Read the company’s annual report, investor presentations and management discussions. Step 2: Analyze the Industry and Competition A good company operating in a weak or declining industry may face significant challenges. Check: Compare the company with 2–3 key competitors on revenue growth, margins, profitability and market position. Step 3: Evaluate Management Management quality can significantly influence long-term business performance. Look at: Good financial numbers are more meaningful when supported by strong corporate governance. Step 4: Study Financial Statements There are three key financial statements. Profit & Loss Statement Shows revenue, expenses and profit. Look for consistent revenue and profit growth over several years. Balance Sheet Shows the company’s assets, liabilities and shareholders’ equity. Pay particular attention to debt and changes in net worth. Cash Flow Statement Shows how actual cash moves through the business. Operating cash flow is particularly important because a company can report accounting profits while generating weak cash. Try to examine at least five years of financial data rather than focusing on a single year. For additional learning material, ISFM provides a Fundamental Analysis Guide. Step 5: Check Profitability Ratios Important ratios include: Don’t judge a company using one year’s ratio. Look for consistency and trends. Step 6: Check Debt and Financial Health Debt can become dangerous when business conditions deteriorate. Check: Lower debt is not automatically better for every industry, so always compare companies with relevant peers. Step 7: Analyze Valuation A great business can still be a poor investment if purchased at an excessive valuation. Common valuation metrics include: Compare valuation with the company’s historical range and industry peers rather than treating one ratio as a buy or sell signal. Step 8: Identify Risks and Red Flags Before investing, actively search for reasons why your thesis could be wrong. Watch for: SEBI’s investor education resources also emphasise understanding securities, risks and conducting informed investment research. Step 9: Build an Investment Thesis After completing your research, write down: This simple exercise can prevent emotional decisions during market volatility. Investors who want to combine business analysis with chart-based analysis can also explore ISFM’s Technical Analysis Course. Frequently Asked Questions 1. How do I analyze a stock before investing? Study the business, industry, management, financial statements, profitability, debt, valuation and risks before making an investment decision. 2. Which financial ratios should beginners learn? Start with ROE, ROCE, profit margin, debt-to-equity, P/E and operating cash flow. Then gradually learn more advanced valuation metrics. 3. Is fundamental analysis better than technical analysis? They serve different purposes. Fundamental analysis focuses on the business and long-term value, while technical analysis focuses on price and market behaviour. 4. How many years of financial data should I study? For a basic analysis, studying at least five years of financial data can help identify meaningful trends. Final Takeaway According to Sushil Alewa, SEBI Registered Research Analyst (INH100009433), Fundamental analysis is not about finding a “perfect stock.” It is about developing a rational framework for evaluating businesses. Before investing, ask yourself: “Do I understand this business, trust its management, and believe it can become significantly larger and more profitable over the next 5–10 years?” If you can answer that question with evidence rather than emotion, you are already thinking more like a fundamental investor. For broader stock-market education, explore the ISFM Stock Market Course, which covers fundamental analysis alongside technical analysis, derivatives and risk management. This article is for educational purposes only and is not a recommendation to buy or sell any specific stock.

Best Ethanol Stocks in India to Watch in 2026
Blog

Best Ethanol Stocks in India to Watch in 2026

India’s growing focus on renewable energy and reducing crude oil imports has made ethanol stocks in India an attractive investment theme. The Government of India continues to promote ethanol blending with petrol under the Ethanol Blended Petrol (EBP) Programme, encouraging sugar companies to expand their ethanol production capacity. As demand for cleaner fuels increases, several listed companies are investing in distilleries and biofuel infrastructure. In this article, we’ll explore some of the best ethanol stocks in India and the factors investors should consider before investing. Why Are Ethanol Stocks Gaining Attention? The Indian government has been actively supporting ethanol production through favorable policies and blending targets. This creates multiple long-term benefits: If you’re new to stock market investing, understanding industry trends and company financials is essential before selecting sector-specific stocks. Our Stock Market Course provides a strong foundation for beginners looking to build long-term investing skills. Top Ethanol Stocks in India 1. Balrampur Chini Mills Ltd. Balrampur Chini Mills is among India’s leading integrated sugar manufacturers and one of the country’s largest ethanol producers. The company continues to expand its distillery capacity to benefit from rising ethanol demand. Key Highlights 2. Triveni Engineering & Industries Ltd. Triveni Engineering operates across sugar, ethanol, engineering, and power generation businesses. The company has significantly increased its ethanol production capacity in recent years. Why Investors Like It Investors often combine company research with chart analysis to identify better buying opportunities. Learning these techniques through a Technical Analysis Course can help improve entry and exit decisions. 3. Shree Renuka Sugars Ltd. Shree Renuka Sugars is one of India’s largest sugar manufacturers with a strong presence in ethanol production. The company continues investing in expanding its biofuel business. Strengths 4. EID Parry (India) Ltd. Part of the Murugappa Group, EID Parry is one of India’s oldest sugar companies. Besides sugar manufacturing, the company has steadily expanded its ethanol production capabilities. Highlights Before investing in any company, it is important to evaluate financial statements, profitability, and valuation. A Fundamental Analysis Course can help investors understand these important parameters. 5. Dalmia Bharat Sugar & Industries Ltd. Dalmia Bharat Sugar manufactures sugar, industrial alcohol, ethanol, and power. The company has been steadily increasing its ethanol production capacity to meet growing industry demand. Investment Positives Factors to Consider Before Investing Before investing in ethanol stocks, evaluate the following: Long-term investors should always focus on businesses with strong fundamentals rather than investing solely based on market trends. Is the Ethanol Sector a Good Long-Term Investment? The ethanol industry enjoys strong policy support from the Government of India. Rising fuel demand, increasing blending targets, and investments in renewable energy make the sector attractive for long-term investors. However, investors should also remember that ethanol companies are closely linked with the sugar industry. Weather conditions, sugar production, raw material prices, and government regulations can impact their earnings. For traders who prefer short-term opportunities, ethanol stocks often witness volatility around government announcements and quarterly results. Learning advanced trading strategies through an Options Trading Course or Algo Trading Course can help traders manage risk and make informed decisions. Conclusion India’s transition toward cleaner energy is expected to drive long-term growth in ethanol production. Companies such as Balrampur Chini Mills, Triveni Engineering, Shree Renuka Sugars, EID Parry, and Dalmia Bharat Sugar remain among the leading ethanol-related stocks in India. While the sector offers promising opportunities, investors should always evaluate company fundamentals, future growth plans, valuations, and overall market conditions before making investment decisions. Frequently Asked Questions 1. Which are the best ethanol stocks in India? Some of the leading ethanol stocks include Balrampur Chini Mills, Triveni Engineering & Industries, Shree Renuka Sugars, EID Parry (India), and Dalmia Bharat Sugar & Industries. 2. Why is ethanol important for India? Ethanol helps reduce crude oil imports, lowers carbon emissions, supports sugar farmers, and contributes to India’s renewable energy goals. 3. Are ethanol stocks good for long-term investment? They offer long-term growth potential due to government support and increasing demand for biofuels. However, investors should always analyze company fundamentals before investing. 4. What risks affect ethanol companies? Major risks include changes in government policies, fluctuations in sugar prices, weather-related crop issues, and raw material availability.

Scroll to Top
Get Free Demo Class in Live Market Trading
Be an Expert
Stock Trader

Just in One Month

16+

Years of Experience

30,000

Students Trained


Call Now