Do Indicators Work in the Stock Market?
The simple answer is yes, stock market indicators can work, but they are not magic formulas that guarantee profits. Indicators are tools that help traders analyze market behavior, identify trends, and make informed decisions. However, their effectiveness depends on how they are used. Successful traders do not rely solely on indicators; they combine them with price action, market knowledge, and proper risk management.
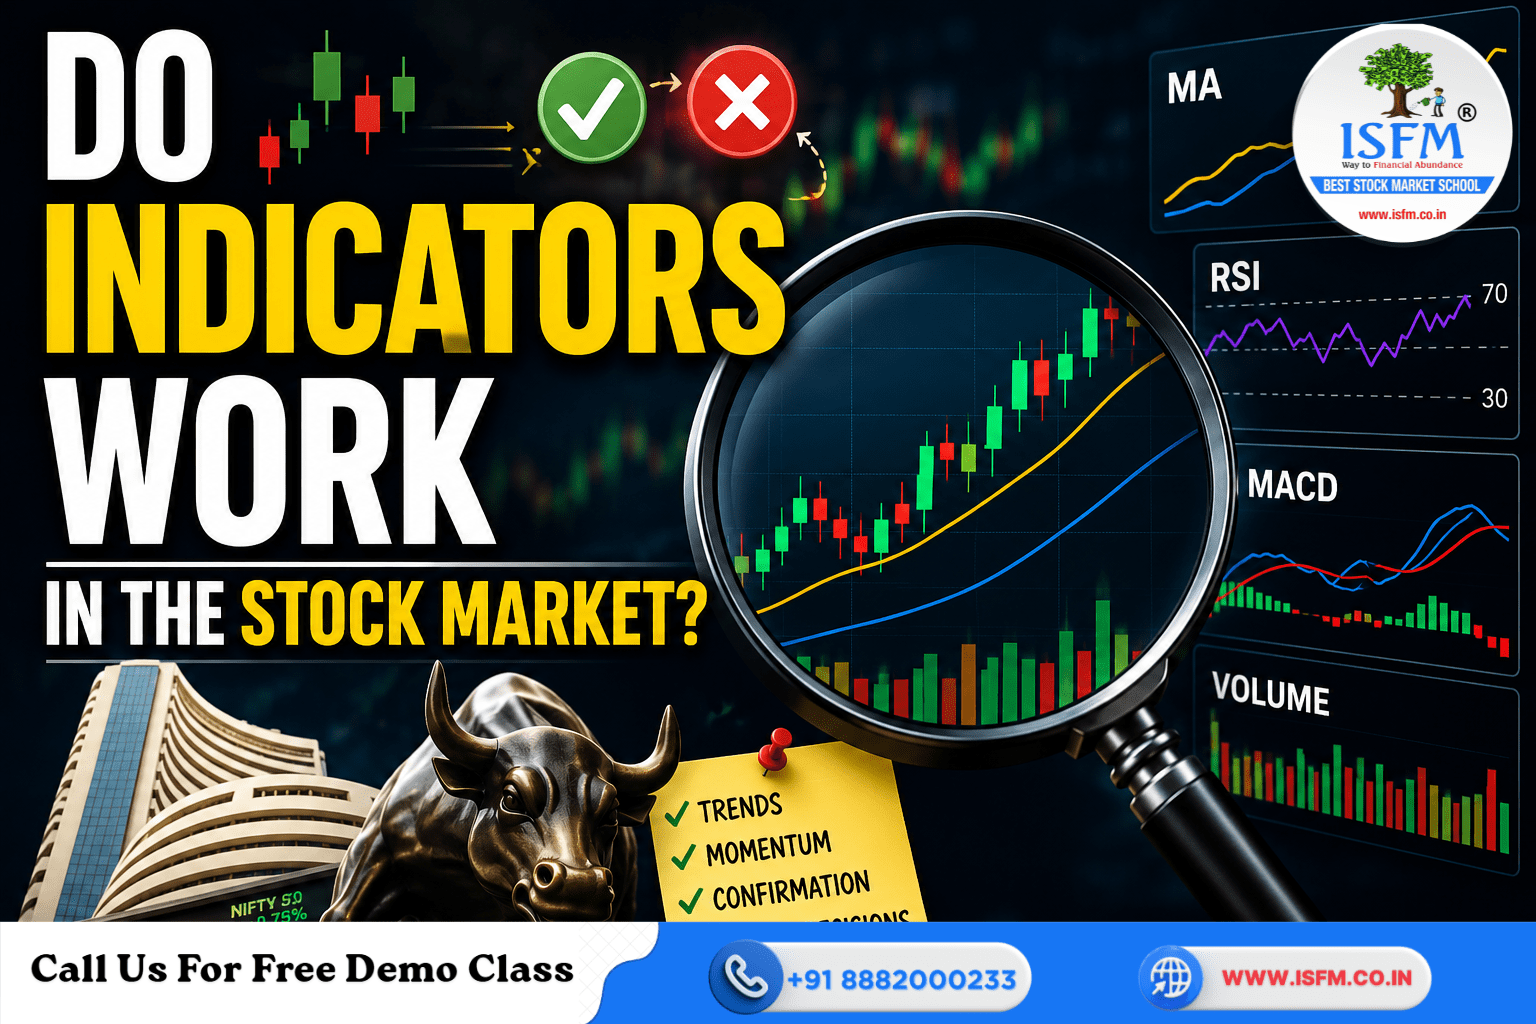
What Are Technical Indicators?
Technical indicators are mathematical calculations based on a stock’s price, volume, or open interest data. They are designed to help traders understand market trends, momentum, volatility, and potential entry or exit points.
Some of the most popular indicators include:
- Relative Strength Index (RSI)
- Moving Averages (MA)
- MACD (Moving Average Convergence Divergence)
- Bollinger Bands
- Volume Indicators
These tools are widely taught in professional technical analysis courses, as they help traders make more structured decisions instead of trading based on emotions. If you want to learn these concepts in depth, you can explore a professional Technical Analysis Course offered by ISFM: Technical Analysis Course
Indicators Are Based on Past Data
One important fact every trader must understand is that indicators are based on historical market data. They analyze what has already happened in the market and use that information to provide possible future signals.
For example, if the RSI shows that a stock is overbought, it does not mean the stock will immediately fall. It simply indicates that the stock has risen significantly and may be due for a correction.
This is why indicators should never be viewed as prediction machines. They provide probabilities, not certainties.
Indicators Work Best as Trend Confirmation Tools
Many beginners make the mistake of treating indicators as standalone buy or sell signals. In reality, indicators work much better when used to confirm an existing trend.
For example, imagine the Nifty 50 is trading above its 50-day and 200-day moving averages. This suggests that the broader trend is bullish. If the RSI also shows positive momentum and volume is increasing, traders gain additional confidence that the uptrend is strong.
Instead of creating trades, indicators often help traders validate what the price is already showing.
Different Indicators for Different Market Conditions
Not all indicators work equally well in every market environment.
Trend-Following Markets
Indicators such as:
- Moving Averages
- MACD
- ADX
perform well when markets are trending strongly.
For example, during a strong rally in Reliance Industries, traders may use the 50-day moving average to stay invested as long as the stock remains above the trend line.
Range-Bound Markets
When stocks move sideways, indicators like:
- RSI
- Stochastic Oscillator
- Bollinger Bands
often become more useful.
For instance, if Infosys trades within a defined range for several weeks, RSI may help identify oversold and overbought conditions that could lead to short-term reversals.
Why Combining Indicators Is Important
Professional traders rarely depend on a single indicator. Instead, they combine multiple tools to improve the quality of their signals.
A common combination might include:
- Moving Average for trend direction
- RSI for momentum
- Volume for confirmation
For example, suppose Tata Motors breaks above a resistance level. A trader may look for:
- Price above key moving averages
- RSI above 60
- Higher-than-average volume
When all three conditions align, the probability of a successful trade may improve.
Many traders who enroll in an Options Trading Course learn how to combine technical indicators with derivatives strategies for better decision-making. Learn more here: Options Trading Course
Real Indian Market Examples
1.) RSI on Nifty 50
Suppose the Nifty 50 falls sharply and RSI drops below 30. Many traders consider this an oversold condition. If the index starts forming bullish candlestick patterns near a strong support level, traders may anticipate a short-term bounce.
2.) MACD on Reliance
During major uptrends, traders often use MACD crossovers as confirmation signals. A bullish MACD crossover combined with rising volumes in Reliance has historically provided confirmation of improving momentum.
3.) Volume Analysis in Tata Motors
When Tata Motors breaks an important resistance level with unusually high trading volume, traders often view it as a sign that institutional buyers are participating in the move.
Limitations of Indicators
Although indicators are useful, they have several limitations.
1.) False Signals
During volatile or sideways markets, indicators can generate frequent false buy and sell signals.
2.) Lagging Nature
Most indicators are lagging indicators. They react to price movements rather than predict them. By the time a signal appears, a significant part of the move may already have occurred.
Over-Reliance
Some traders become dependent on indicators and ignore:
- Price action
- Company fundamentals
- Market sentiment
- Risk management
This can lead to poor trading decisions.
For traders seeking a complete understanding of markets, combining technical analysis with broader market education through a Chartered Stock Trading Expert Course can be beneficial: Chartered Stock Trading Expert Course
Practical Tips for Indian Retail Traders
Here are some practical guidelines:
- Use indicators as filters, not absolute rules.
- Combine indicators with price action and support/resistance levels.
- Always follow proper risk management.
- Test your strategy through paper trading before risking significant capital.
- Focus on only 2–3 indicators to avoid confusion and overfitting.
- Maintain a trading journal to evaluate what works and what doesn’t.
Conclusion
So, do indicators work in the stock market? The answer is yes—but only when used correctly. Indicators can help traders identify trends, measure momentum, and confirm trading opportunities. However, they are not magic tools that guarantee profits.
Successful traders understand that indicators are just one part of a complete trading system. Combining them with price action, support and resistance analysis, risk management, and market experience leads to better decisions. Ultimately, success in trading depends not on which indicators you choose, but on how effectively you use them within a disciplined trading plan.