5 Most Reliable Chart Patterns for Spotting Multibagger Stocks
Most multibagger stocks are not created by luck—they follow structured price behavior before explosive moves. While strong fundamentals drive long-term growth, technical chart patterns help traders identify the right timing to enter early.
If you’re new to reading charts, building a strong base through a technical analysis course can significantly improve your ability to identify such high-probability setups.
In this article, we break down the five most reliable chart patterns that have historically appeared in multibagger stocks, along with practical insights to help you spot them before the big breakout.
Why Chart Patterns Matter for Multibaggers
Multibagger stocks typically evolve in three phases:
- Accumulation Phase – Smart money builds positions
- Breakout Phase – Price moves out of consolidation
- Expansion Phase – Sustained uptrend
Chart patterns form during the accumulation and early breakout stages, offering structured entry opportunities. When combined with fundamental strength, these setups become even more powerful—something you can master through a fundamental analysis training program alongside technical skills.
1. Cup and Handle Pattern
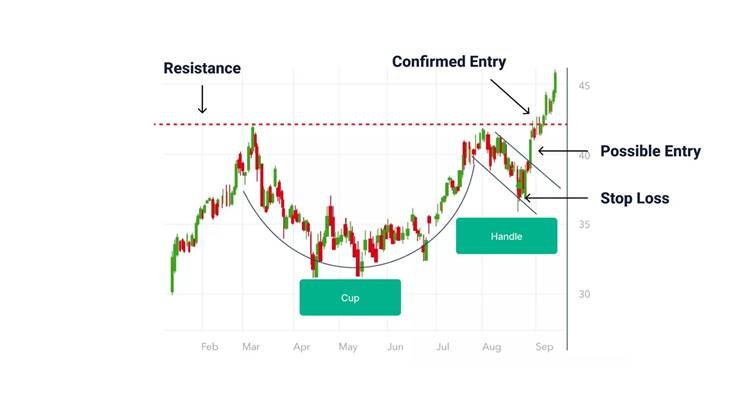
A cup and handle is a bullish continuation pattern where price forms a rounded base followed by a shallow pullback. It reflects gradual accumulation before a breakout.
Example Insight
Stocks like Eicher Motors have historically formed rounded bases and tight handles near resistance. Breakouts from such structures often lead to strong trending moves supported by volume expansion.
Key signals:
- Smooth rounded base
- Tight consolidation near highs
- Volume surge on breakout
2. Double Bottom Pattern
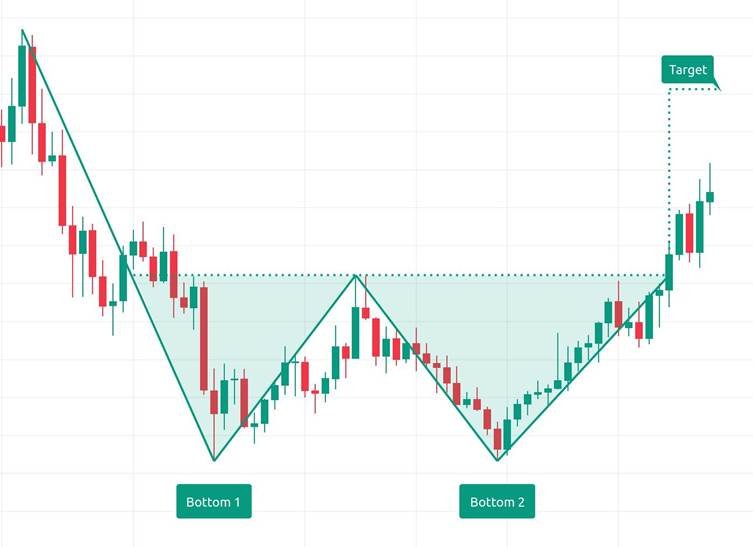
A double bottom is a reversal pattern forming a “W” shape. Price tests support twice before breaking above the neckline.
Example Insight
Many mid-cap and sectoral stocks form this pattern after corrections.
Key signals:
- Two similar lows
- Breakout above neckline
- Increasing volume
3. Ascending Triangle
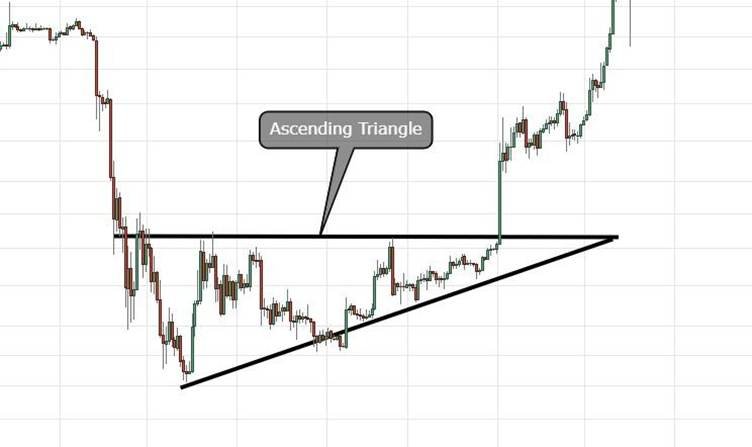
This pattern consists of a flat resistance level and rising support. It reflects increasing buying pressure.
Example Insight
Leading stocks often consolidate in ascending triangles before strong breakouts. Once resistance is cleared, price typically moves sharply due to accumulated demand—an approach widely used in advanced derivatives and trading strategies.
Key signals:
- Repeated resistance tests
- Rising higher lows
- Breakout with volume
4. Flag / High-Tight Flag
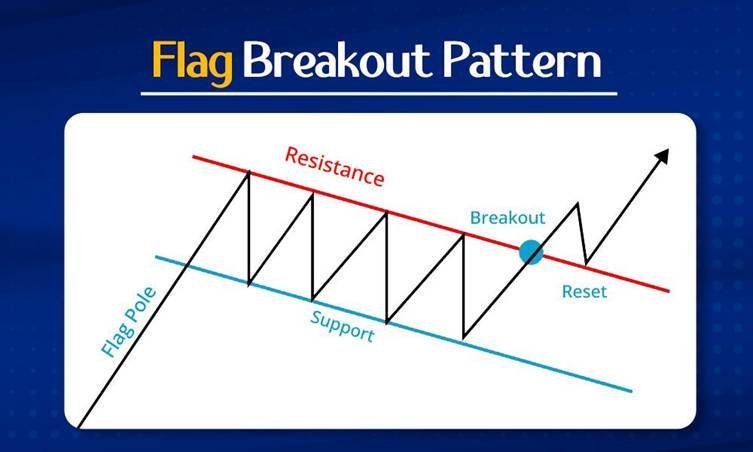
A flag pattern forms after a sharp rally followed by a short consolidation. High-tight flags are rare and indicate strong momentum.
Example Insight
Momentum traders often rely on such continuation setups to capture trending moves.
Key signals:
- Strong prior rally
- Controlled pullback
- Continuation breakout
5. Volatility Contraction Pattern (VCP)
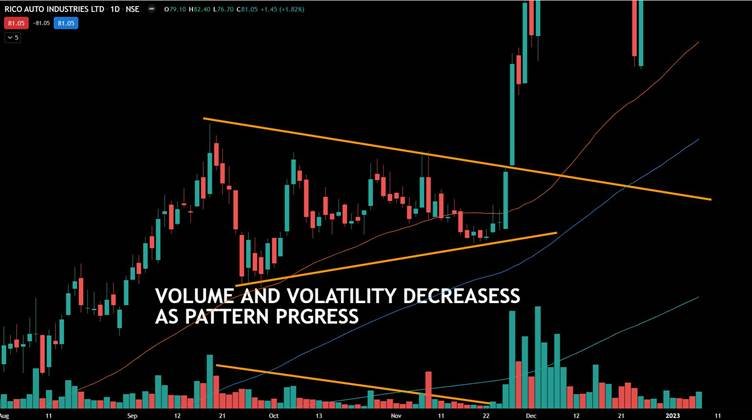
VCP consists of progressively smaller price swings, indicating reduced volatility before a breakout.
Example Insight
Professional traders use VCP to identify stocks where supply is drying up before a strong move. These advanced concepts are often explored in specialized programs like algo trading and advanced strategy courses.
Key signals:
- Shrinking price ranges
- Declining volume
- Breakout with expansion
Practical Checklist
Before acting on any pattern:
- Confirm overall uptrend
- Look for strong breakout volume
- Check fundamental strength
- Prefer clean chart structures
- Use proper stop-loss levels
Conclusion
Chart patterns provide a structured way to identify high-probability opportunities, but they work best when aligned with strong fundamentals and disciplined execution.
The ability to recognize these formations early in the accumulation phase can significantly improve your chances of identifying multibagger stocks before they enter a sustained uptrend.
For traders looking to master both technical and practical execution, combining learning with real-market exposure through professional training can accelerate results significantly.
If you found this blog helpful, you might also like this article: What is Cup & Handle Pattern? How to spot it in Stock Charts?