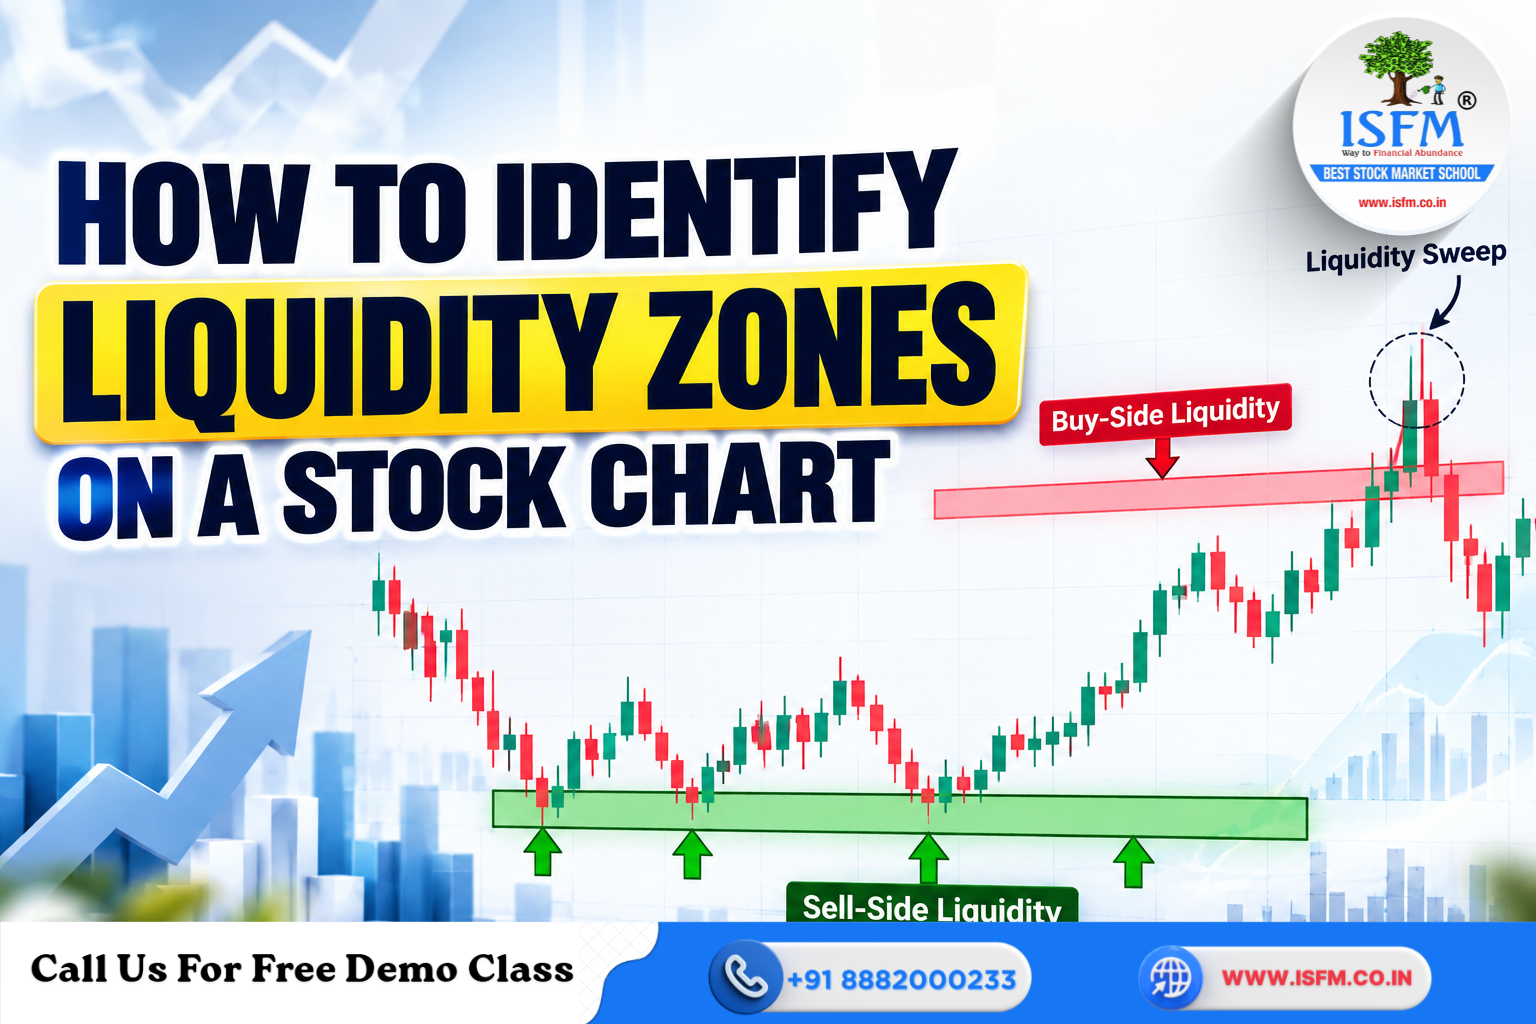
A stock trades repeatedly near ₹500 and forms two similar highs around ₹510. Traders may place stop-losses above ₹510, while breakout traders may prepare to buy above this level. If the stock rises to ₹512 and then falls below ₹510, traders may describe the move as a liquidity sweep.
According to Sushil Alewa, SEBI Registered Research Analyst (INH100009433), liquidity analysis helps traders identify important price areas where orders may be concentrated and observe whether the market rejects or accepts those levels. However, these zones are estimates, not proof of institutional activity.
Understanding liquidity zones on stock charts helps traders identify important price areas and observe potential market reactions. However, these zones are estimates, not confirmed locations of institutional orders.
What Is a Liquidity Zone?
A liquidity zone is an estimated price area where buy orders, sell orders, stop-losses, and pending entry orders may cluster. A normal candlestick chart cannot reveal the identity or complete positions of market participants.
Traders use price action, volume, and market structure to estimate these areas. Learning to read these patterns is an important part of Technical Analysis Course, which helps traders understand price behaviour and chart patterns.
Buy-Side and Sell-Side Liquidity
Buy-side liquidity is commonly estimated above recent highs, equal highs, and resistance levels. Short sellers may have stop-loss buy orders above these areas, alongside breakout buy orders.
Sell-side liquidity is commonly estimated below recent lows, equal lows, and support levels, where long traders’ stop-loss orders may cluster.
For example, if an NSE stock forms equal highs near ₹1,000 and equal lows near ₹960, traders may watch above ₹1,000 for potential buy-side liquidity and below ₹960 for potential sell-side liquidity. Neither level guarantees a reversal.
How to Identify Liquidity Zones on Stock Charts
- Mark swing highs and lows. Identify significant turning points that produced clear rejections or strong price movements. Previous day highs and lows and weekly extremes are useful references.
- Find equal highs and equal lows. Repeated highs or lows attract attention because traders often monitor these obvious levels for breakouts and stop-loss placement.
- Identify range boundaries. During consolidation, potential buy-side liquidity may exist above the range high, while sell-side liquidity may lie below the range low.
- Mark round numbers. Levels such as ₹100, ₹500, ₹1,000, and Nifty 25,000 may attract attention. Previous session levels, gap boundaries, and important option strikes can also provide useful context.
Traders interested in Advanced Derivatives Course can apply these concepts to understanding price levels in futures and options markets.
Use Volume to Support Your Analysis
Volume helps identify areas of concentrated trading activity. Volume Profile highlights high-volume nodes, where substantial trading occurred, and low-volume areas with comparatively less activity.
A volume spike during a breakout may indicate increased participation. However, volume alone cannot prove institutional buying or selling. Bid-ask spreads, market depth, turnover, and price impact also influence market liquidity.
For a broader understanding of market behaviour, Fundamental Analysis Course can complement chart-based analysis by helping traders evaluate a company’s financial position and business fundamentals.
Liquidity Sweep vs Genuine Breakout
A liquidity sweep occurs when price briefly moves beyond an obvious high or low and then returns inside the previous range.
For example, Bank Nifty may cross a previous session high but quickly fall below it. This could indicate a failed breakout. Conversely, a strong close beyond the level, followed by continued movement, may suggest a genuine breakout.
| Feature | Possible liquidity sweep | Possible genuine breakout |
| Price action | Brief move beyond a level | Strong close beyond a level |
| Follow-through | Quickly reverses | Continues moving |
| Retest | Returns inside the range | Broken level may hold |
| Volume | Spike followed by rejection | Sustained activity may support continuation |
No single feature confirms either outcome. Wicks can result from ordinary volatility, changing demand and supply, or order execution—not necessarily manipulation.
A Practical Trading Checklist
- Identify the higher-timeframe trend.
- Mark swing highs, lows, and equal levels.
- Highlight range boundaries and round numbers.
- Observe volume and market depth where available.
- Wait for price to reach the zone.
- Look for rejection, acceptance, or a market-structure shift.
- Define risk before entering and review the results.
For options traders, remember that underlying price movements do not determine premiums alone. Implied volatility, time to expiry, and other factors also matter. The Options Trading Course can help learners explore option strategies and risk management.
Frequently Asked Questions
1. How do you identify liquidity zones?
Look for previous highs and lows, equal highs and lows, range boundaries, round numbers, and areas of significant trading activity.
2. What is buy-side liquidity?
It is a potential concentration of orders above visible highs, including short sellers’ stop-losses and breakout buy orders.
3. What is a liquidity sweep?
It is a brief move beyond an obvious price level followed by a return inside the previous range.
4. Can liquidity zones predict reversals?
No. They highlight areas to monitor, but price may reverse, consolidate, or continue through them.
Conclusion
Liquidity zones help traders organise charts around potential order concentrations and price reactions. Use them alongside market structure, volume, and confirmation—not as standalone entry signals.
Disclaimer: This article is for educational purposes only and is not investment advice. Stock, futures, and options trading involve financial risk and may result in substantial losses.