Author name: viratbhushan22@gmail.com

Difference Between NISM and NCFM
Blog

Difference Between NISM and NCFM: Which One Should You Choose?

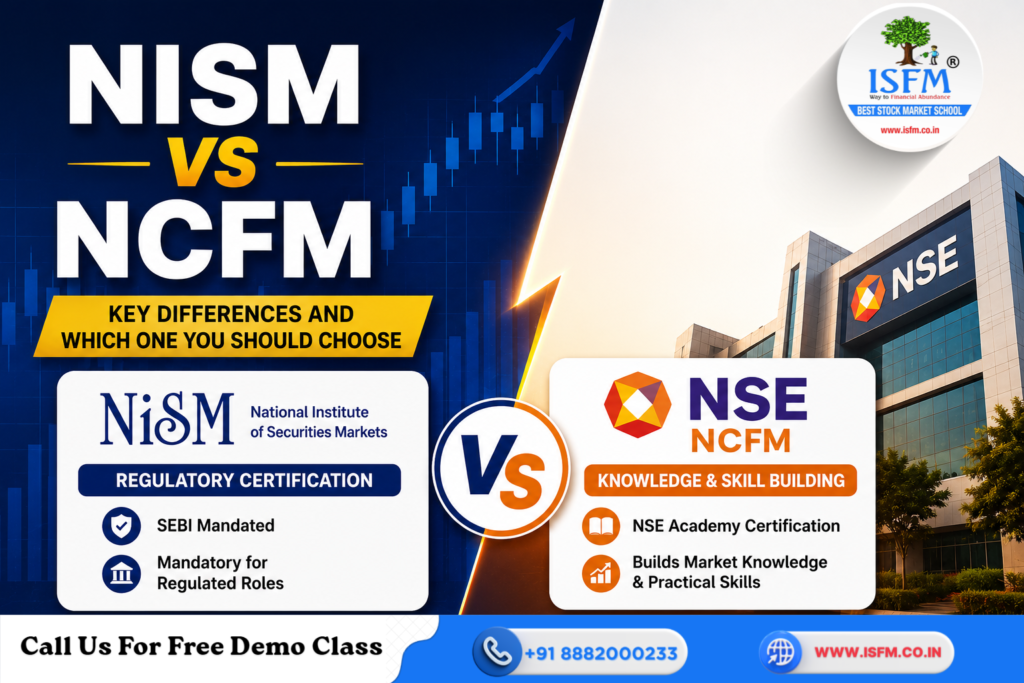
Choosing the right certification is one of the first decisions for anyone planning a career in the Indian stock market. Whether you’re a student, a working professional, or someone looking to become a mutual fund distributor or research analyst, you’ve probably come across two popular names—NISM and NCFM. This often leads to a common question: Which certification is better—NISM or NCFM? The truth is that NISM and NCFM are not competitors. They serve different purposes and are designed for different career goals. Understanding these differences will help you make the right choice without getting influenced by marketing claims. If you’re planning to build a long-term career in financial markets, exploring professional stock market courses alongside certifications can give you practical exposure that goes beyond theoretical learning. ISFM offers a range of Share Market Courses designed for beginners as well as aspiring market professionals. What Is NISM? NISM (National Institute of Securities Markets) is an educational institution established by the Securities and Exchange Board of India (SEBI). Its primary objective is to improve the quality and professionalism of India’s securities markets through education, training, and certification. Many roles regulated by SEBI require candidates to hold specific NISM certifications before they can legally work in those positions. Some examples include: For these regulated roles, obtaining the relevant NISM certification is not optional—it is a regulatory requirement. If you’re preparing for these exams, enrolling in a structured NISM Certification Course can help you understand the syllabus, exam pattern, and practical applications more effectively. What Is NCFM? NCFM (NSE Certification in Financial Markets) is offered by NSE Academy, the educational arm of the National Stock Exchange (NSE). Unlike NISM, NCFM focuses on developing practical knowledge and skills across various financial market subjects. Popular NCFM modules include: NCFM certifications demonstrate your knowledge in a particular subject and can strengthen your resume, especially when applying for internships or entry-level jobs. However, NCFM does not replace NISM certifications wherever SEBI has made NISM mandatory. When Should You Choose NISM? You should prioritize NISM certification if your career goal involves working in regulated financial market roles. Examples include: An Associated Person is someone who performs regulated market activities on behalf of a registered intermediary like a stock broker. If the job legally requires certification, it is almost always a NISM certification. Students planning a complete career in financial markets often complement their certification with a comprehensive Financial Market Expert (FMX) program, which covers multiple market segments beyond the certification syllabus. When Should You Choose NCFM? NCFM is ideal if your objective is learning rather than regulatory compliance. Choose NCFM if: For candidates interested in chart reading and market analysis, pairing NCFM with a practical Technical Analysis Course helps bridge the gap between theory and real-market application. Can You Do Both? Many successful finance professionals hold both NISM and NCFM certifications because they complement each other. For example: Think of it this way: Together, they create a stronger professional profile. Professionals interested in becoming full-time traders can also benefit from specialized Options Trading Courses, which provide practical insights into derivatives strategies and risk management. Conclusion The debate between NISM vs NCFM isn’t about which certification is better—it’s about which one aligns with your career goals. If your objective is to become legally eligible for regulated roles such as a Research Analyst, Mutual Fund Distributor, or Investment Adviser, NISM should be your first priority. If you’re looking to build market knowledge, improve your resume, and deepen your understanding of financial markets, NCFM is an excellent learning credential. For professionals planning a long-term career in India’s capital markets, combining NISM for regulatory compliance with NCFM for additional expertise can be a smart strategy. Alongside these certifications, gaining practical knowledge through structured stock market courses can further strengthen your skills and career prospects. Choose your certification based on where you want your career to go—not on hype or popular opinion.


Closing Auction Session
Blog

Closing Auction Session (CAS): Meaning, Timings, Benefits & How It Works

India’s stock market has entered a new era with the introduction of the Closing Auction Session (CAS) for stocks listed in the Futures & Options (F&O) segment. Effective 3 August 2026, this new mechanism changes the way the official closing price of F&O stocks is determined, making the market more transparent, efficient, and globally aligned. The move is expected to improve price discovery, reduce market manipulation, and provide better execution for institutional as well as retail investors. In this article, let’s understand what CAS is, how it works, the revised market timings, and its impact on traders and investors. What is the Closing Auction Session (CAS)? The Closing Auction Session (CAS) is a 20-minute auction conducted after regular trading hours for stocks that are part of the F&O segment. Unlike the earlier system, where the closing price was calculated using the Volume Weighted Average Price (VWAP) of the last 30 minutes of trading, CAS determines the closing price through an auction mechanism. During this session: The objective is to ensure that the closing price truly reflects market demand and supply instead of being influenced by a few trades near market close. Why Was CAS Introduced? The previous VWAP-based closing price method worked reasonably well but had certain limitations. Some of the major reasons behind introducing CAS include: Leading exchanges across the world, including the New York Stock Exchange (NYSE) and the London Stock Exchange (LSE), already use closing auctions. Which Stocks Are Covered Under CAS? The Closing Auction Session applies only to: Stocks that are not part of the F&O segment will continue trading normally until 3:30 PM, with no changes in their closing price calculation. New Market Timings Under CAS The introduction of CAS changes the trading schedule for different market segments. Market Segment New Timings Equity Cash Market (F&O Stocks) 9:15 AM – 3:15 PM Closing Auction Session 3:15 PM – 3:35 PM F&O Market 9:15 AM – 3:40 PM Non-F&O Stocks Continue till 3:30 PM Revised Intraday (MIS) Square-Off Timings The CAS implementation also changes intraday square-off timings. Cash Market MIS Orders F&O MIS Orders How Does the Closing Auction Session Work? The auction follows a structured process. Step 1: Order Collection From 3:15 PM onwards, the exchange begins collecting buy and sell orders. No immediate trade execution takes place during this period. Step 2: Price Discovery The exchange evaluates every possible price level and identifies the price where the maximum quantity of shares can be matched. This is called the Equilibrium Price. Step 3: Order Matching Once the equilibrium price is determined: Why Isn’t the Last Trade Considered the Closing Price? Using the last traded price can create inaccurate closing prices. For example: A stock trades around ₹880 throughout the day. Just before market close, a few small trades happen at ₹862. If the last traded price became the official close, it would misrepresent the stock’s actual market value. To prevent this, exchanges previously used the VWAP method. Now, CAS provides an even more reliable mechanism. Limitations of the Earlier VWAP Method Although VWAP reduced manipulation, it still had some drawbacks. These included: CAS addresses these issues through auction-based price discovery. Major Benefits of CAS 1. Better Price Discovery The auction considers all eligible buy and sell orders together, producing a fair market-driven closing price. 2. Lower Market Impact Large institutional investors can execute sizable orders without significantly moving prices. 3. Reduced Manipulation Manipulating the closing price becomes much harder because a single trade cannot influence the auction result. 4. Improved ETF and Index Fund Performance Passive investment funds can replicate benchmark indices more accurately, reducing tracking error. 5. Global Best Practices CAS aligns Indian markets with developed global exchanges. What Happens to Open Orders at 3:15 PM? Different order types are treated differently during CAS. Limit Orders Stop Loss (SL) Orders Iceberg Orders GTT Orders Traders should review pending orders before the auction begins. Understanding the Reference Price The Reference Price plays an important role in CAS. It is calculated using the VWAP of trades between 3:00 PM and 3:15 PM. The reference price is used to: It is important to note that the reference price is not the final closing price unless no trades occur during the auction. What Happens if Multiple Prices Can Be Chosen? Sometimes more than one price allows the same maximum executable quantity. In such situations, the exchange follows these rules: What is the Random Closing Mechanism? To prevent last-second manipulation: What Changes for F&O Traders? F&O participants will notice several important changes. 1.) Extended Trading Hours F&O contracts now trade until 3:40 PM. 2.) Settlement Price Expiry settlement for stock futures and options will now use the CAS closing price of the underlying stock instead of the previous VWAP. 3.) Price Band A ±3% price band applies to stock futures during the extended trading period. 4.) Index Movement Between 3:15 PM and approximately 3:35 PM, indices such as the Nifty and Sensex may appear static because constituent F&O stocks are participating in the auction. The indices update once the auction concludes and official closing prices are published. Advantages of Closing Auction Session (CAS) Limitations of CAS Tips for Traders To make the most of CAS: Conclusion The introduction of the Closing Auction Session (CAS) represents a significant modernization of India’s equity market structure. By replacing the earlier VWAP-based closing price mechanism with an auction-driven process, regulators aim to improve fairness, enhance liquidity, reduce price manipulation, and strengthen investor confidence. While traders may need some time to adjust to the revised timings and order-handling process, CAS is expected to deliver more efficient price discovery and better execution quality over the long term. For both institutional and retail investors, understanding how CAS works will be essential for making informed trading and investment decisions in the evolving Indian stock market.

How to Read Candlestick Charts Like a Pro Trader
Blog

How to Read Candlestick Charts Like a Pro Trader (Step-by-Step Guide)

Every trader sees red and green candles on a chart, but only a few truly understand what those candles are saying. Beginners often spend hours memorising candlestick names like Hammer, Doji, or Engulfing, yet still struggle to make profitable trading decisions. Professional traders approach candlestick charts differently. Instead of treating candles as random patterns, they read them as a story of the ongoing battle between buyers and sellers. Every candle reveals who was in control, how strong they were, and whether the market is likely to continue or change direction. In this guide, you’ll learn how to read candlestick charts like a professional by focusing on price action, market context, and market psychology—not by memorising dozens of patterns. If you’re new to chart reading, our Technical Analysis Course provides practical training on candlestick charts, chart patterns, trend analysis, and trading strategies. What Is a Candlestick? Understanding the Basics A candlestick represents the price movement during a selected timeframe and contains four important prices, commonly known as OHLC: Every candlestick consists of two parts: 1. Body The body shows the difference between the opening and closing prices. 2. Wicks (Shadows) The upper and lower wicks show how far price travelled before closing. Long wicks often indicate that one side attempted to take control but was rejected. Candle Colours Rather than focusing only on colours, ask yourself: Who controlled this candle—buyers or sellers? Long Green Candle A long green body with small wicks shows strong buying pressure. Buyers dominated the session and managed to hold prices near the highs. Long Red Candle A long red candle indicates aggressive selling. Sellers controlled the market and pushed prices lower throughout the session. Long Upper Wick A candle with a long upper wick shows that buyers initially pushed prices higher, but sellers stepped in and rejected those higher levels. This often signals resistance. Long Lower Wick A long lower wick suggests sellers drove prices down, but buyers entered aggressively and recovered most of the losses before the candle closed. This reflects strong buying interest. Doji A Doji has a very small body and represents indecision. Neither buyers nor sellers gained meaningful control during that period. Instead of asking, “What pattern is this?” ask: “Who was winning this battle?” That simple shift in thinking separates professional traders from beginners. To master candlestick psychology with live market examples, explore our Candlestick Bible. Three Types of Candles Every Professional Watches Professionals don’t memorise 50 or 100 candlestick patterns. Instead, they classify candles into three practical categories. 1. Strength Candles These candles have: They indicate conviction and usually support the existing trend. 2. Control-Shift Candles These candles suggest momentum may be changing. Examples include: They often appear near major support or resistance zones. 3. Indecision Candles Examples include: These candles show balance between buyers and sellers. They don’t predict direction by themselves but indicate the market is preparing for its next move. Why Context Matters More Than the Candle One of the biggest mistakes beginners make is treating every candlestick as a buy or sell signal. Professional traders know that context is everything. Always analyse: 1.) Trend Is the market: A bullish candle during an uptrend carries much more significance than the same candle inside a sideways market. 2.) Support and Resistance Location changes everything. For example: A Hammer forming at a strong support level after a decline has much greater importance than a Hammer appearing randomly in the middle of a range. Similarly, a Shooting Star near resistance is more meaningful than one appearing without context. 3.) Previous Candles Never analyse one candle in isolation. Always ask: Professional traders combine candlesticks with market structure rather than relying on patterns alone. To learn how professionals build high-probability trading setups using candlesticks, support and resistance, and trend analysis, check out our Professional Trading Setups. Key Candlestick Patterns Worth Knowing Instead of memorising dozens of patterns, focus on a few high-probability formations. 1.) Hammer (Pin Bar) Meaning: Sellers pushed prices lower, but buyers completely rejected those levels. Most reliable: 2.) Shooting Star Meaning: Buyers attempted to push prices higher but failed. Most reliable: 3.) Bullish and Bearish Engulfing An engulfing pattern occurs when one candle completely covers the previous candle’s body. It often indicates a shift in momentum, especially near important price levels. 4.) Doji A Doji appearing after a strong move can signal exhaustion or indecision. However, confirmation from the next candle is essential before taking a trade. Remember: Patterns are not magic. They work best when combined with trend, support and resistance, and proper risk management. Common Mistakes Beginners Make Many traders fail because they misunderstand candlesticks. Avoid these common mistakes: Successful trading is based on probabilities, not certainty. How to Practise Reading Candlestick Charts Like a Pro Improving your chart-reading skills requires practice, not memorisation. Here’s a simple routine: Over time, you’ll naturally develop pattern recognition and become more confident in reading price action. If you’re looking for structured mentorship with live market practice, our Chartered Stock Trading Expert (CSTX) program teaches technical analysis, candlestick reading, derivatives, options trading, and professional trading strategies. Conclusion Reading candlestick charts like a professional isn’t about memorising hundreds of chart patterns. It’s about understanding the language of the market. Every candle tells a story about buyers, sellers, momentum, rejection, and market sentiment. When you combine that story with trend analysis, support and resistance, and disciplined risk management, candlestick charts become one of the most powerful tools in your trading journey. The next time you open a chart, don’t just look at the candles. Read them. Understand them. Let them tell you the story before you make your next trade. Frequently Asked Questions (FAQs) 1. What is the best way to learn candlestick chart analysis? Start by understanding buyer and seller psychology rather than memorising candlestick patterns. Practice analysing real charts every day. 2. Which candlestick pattern is most reliable? Patterns like Hammer, Engulfing, and Shooting Star are highly effective when they appear at important support or resistance levels and align with

Stock of the Week: PI Industries
Blog

Stock of the Week: PI Industries – A High-Quality Specialty Chemicals Company with Long-Term Growth Potential

PI Industries Ltd. has established itself as one of India’s leading specialty chemicals and life sciences companies. Over the years, the company has transformed from a domestic agrochemical manufacturer into a globally recognized Contract Research, Development & Manufacturing Organization (CRDMO), serving several multinational innovators. Despite short-term challenges in the global agrochemical industry, PI Industries continues to invest in research, innovation, manufacturing capacity, and new business segments such as pharmaceuticals and electronic chemicals. Its strong balance sheet, diversified revenue streams, and global customer base make it an interesting Stock of the Week for long-term investors. If you’re new to evaluating businesses, we recommend first understanding the basics of Fundamental Analysis, which helps investors identify fundamentally strong companies before investing. Company Overview Particular Details Company PI Industries Ltd. Sector Specialty Chemicals & Life Sciences Industry Agrochemicals, CRDMO, Specialty Chemicals Headquarters Udaipur, Rajasthan NSE Symbol PIIND BSE Code 523642 Market Capitalization ~₹41,500 Crore Revenue (TTM) ~₹6,700 Crore Net Profit (TTM) ~₹1,320 Crore Promoter Holding ~46.09% Financial figures are approximate and based on the latest publicly available data. About the Company PI Industries develops, manufactures, and markets specialty chemicals primarily for agriculture and life sciences. Apart from selling crop protection products in India, the company partners with global innovators to manufacture complex chemical molecules under long-term contracts. The company is steadily expanding beyond agrochemicals into pharmaceuticals, biological solutions, electronic chemicals, and advanced specialty materials, reducing dependence on a single industry. Business Model PI Industries operates through two major business segments. A. Export Manufacturing (CRDMO) This is the company’s largest growth engine. Services include: This business generates higher margins due to its technology-intensive nature and long-term customer relationships. B. Domestic Agri Business The company markets a wide range of agricultural products, including: C. Industries Served D. Position in the Value Chain PI Industries participates across the complete value chain: Competitive Advantages To understand how professional traders combine company fundamentals with chart analysis, explore our Technical Analysis Course. Why This Stock Looks Attractive? 1. Global Specialty Chemical Opportunity Global companies are increasingly outsourcing complex chemical manufacturing to India due to cost advantages, skilled talent, and regulatory compliance. PI Industries is among the leading beneficiaries of the global China+1 manufacturing strategy. 2. Diversification Beyond Agrochemicals The company is expanding into: This diversification reduces dependence on agricultural cycles while opening new growth opportunities. 3. Strong Financial Position PI Industries maintains: This enables continuous investments in research, innovation, and capacity expansion. 4. Innovation-Led Business Research and innovation remain at the heart of PI Industries’ strategy. The company continuously invests in: This creates long-term competitive advantages and strengthens customer relationships. If you’re interested in learning how to identify similar high-quality companies, our Share Market Course covers practical stock selection techniques used by experienced investors. Financial Snapshot Metric Value Revenue ~₹6,700 Cr EBITDA ~₹1,700 Cr Net Profit ~₹1,320 Cr ROE ~12% ROCE ~17% Debt to Equity ~0.03 Interest Coverage ~39x Financial Health PI Industries continues to maintain one of the strongest balance sheets within the Indian specialty chemicals industry. The company has negligible debt, healthy return ratios, strong cash generation, and excellent interest coverage, providing ample financial flexibility for future growth initiatives. Although earnings growth has moderated because of the global agrochemical slowdown, the company’s long-term financial position remains robust. Valuation Analysis PI Industries currently trades at a P/E ratio of around 30–31x trailing earnings, reflecting the premium that investors are willing to pay for its high-quality business model. Historically, the company has commanded premium valuation multiples because of: After the recent correction in the specialty chemicals sector, valuations have become relatively more reasonable compared to historical peaks. However, investors should continue tracking earnings recovery and execution of new growth initiatives before drawing valuation conclusions. Investors looking to build diversified long-term portfolios can also explore our Wealth Management Course, where valuation and portfolio allocation are discussed in detail. Key Risks Although PI Industries is considered a high-quality company, investors should carefully monitor the following risks: 1.) Global Agrochemical Slowdown Weak international demand or prolonged inventory correction can impact export revenues and profitability. 2.) Customer Concentration A significant portion of revenue comes from a few global innovators. Any loss of a key customer or delay in product commercialization may impact future earnings. 3.) Raw Material Price Volatility Fluctuations in prices of key intermediates and specialty chemicals can temporarily affect operating margins. 4.) Capex Execution Risk Expansion into pharmaceuticals, biologicals, and electronic chemicals requires successful project execution and timely commercialization. 5.) Potential Growth Triggers & Additional Risks Several developments could positively influence PI Industries’ long-term growth trajectory. Potential Growth Triggers 1.) Recovery in Global Agrochemical Demand A normalization of inventory levels across global markets could improve export orders and manufacturing utilization. 2.) Strong Growth in CRDMO Business Commercialization of newly developed molecules and additional long-term contracts with multinational companies could significantly improve earnings visibility. 3.) Expansion into Life Sciences The company’s investments in pharmaceuticals, biological products, and electronic chemicals have the potential to create new high-margin revenue streams. 4.) Capacity Expansion New manufacturing facilities are expected to improve operating leverage as production volumes increase. 5.) India as a Global Manufacturing Hub The China+1 strategy, government initiatives supporting manufacturing, and increasing global outsourcing provide long-term structural tailwinds for PI Industries. 6.) Additional Potential Risks Investors should also monitor: Final View PI Industries remains one of India’s highest-quality specialty chemical companies with strong research capabilities, long-term customer relationships, and a growing presence in advanced life sciences. Its diversified business model, low debt, consistent profitability, and innovation-driven approach provide a solid foundation for sustainable long-term growth. While the global agrochemical industry is currently facing cyclical headwinds, the company’s expansion into high-value specialty chemical businesses offers meaningful long-term opportunities. Overall, PI Industries appears to be a fundamentally strong business that deserves attention from investors tracking India’s specialty chemicals sector. However, investment decisions should always consider valuation, future earnings growth, and prevailing market conditions. If you wish to build a professional career in stock markets or become a confident investor, explore ISFM’s Chartered Stock Trading Expert (CSTX)

SEBI SIF Distributor Certification
Blog

SEBI Simplifies SIF Distributor Certification: Single NISM Qualification Introduced to Ease Compliance

SEBI Simplifies SIF Distributor Certification: Single NISM Qualification Introduced to Ease Compliance The Securities and Exchange Board of India (SEBI) has simplified the certification process for Specialized Investment Fund (SIF) distributors by introducing a single NISM certification, making it easier for professionals to distribute both mutual funds and SIFs under one qualification. The move is aimed at reducing compliance burden while ensuring that distributors possess the necessary knowledge to advise investors effectively. The revised framework came into effect immediately following SEBI’s circular issued on July 21, 2026. What Has Changed? Previously, individuals distributing Specialized Investment Funds had to obtain two separate certifications: Under the revised regulations, SEBI has replaced this requirement with a single certification: This new qualification authorizes distributors to offer both mutual fund schemes and Specialized Investment Funds, eliminating the need for multiple certifications. Why Did SEBI Revise the Certification Framework? The regulator reviewed the existing framework after receiving industry feedback from market participants and consulting with the National Institute of Securities Markets (NISM). The objective behind the revision includes: Mutual Fund Distributors: What Changes? For professionals dealing only in mutual funds, there is no change. They must continue to hold the: Only distributors intending to sell Specialized Investment Funds (SIFs) need to obtain the new Series V-D certification. SEBI Removes Mandatory Derivatives Certification One of the biggest changes is the removal of the requirement to hold the NISM Series XIII – Common Derivatives Certification. This requirement will officially cease to exist after September 21, 2026, significantly simplifying the qualification process for SIF distributors. Grandfathering Benefit for Existing Distributors To ensure a smooth transition, SEBI has provided a grandfathering provision. Distributors who already possess a valid Series XIII certification obtained on or before September 21, 2026, can continue distributing Specialized Investment Funds until that certification expires. However, they must also continue holding a valid Series V-A certification during this transition period. Once the Series XIII certification expires, distributors must obtain the NISM Series V-D certification to continue selling SIF products. Compliance Guidelines for AMFI and Asset Management Companies SEBI has directed: to ensure that all distributors and agents comply with the revised certification requirements. The updated framework is effective immediately. What are Specialized Investment Funds (SIFs)? Specialized Investment Funds were introduced by SEBI in February 2025 as a new investment category designed to bridge the gap between: SIFs provide greater investment flexibility than conventional mutual funds while remaining more accessible than PMS offerings. Read More:👉 https://www.sebi.gov.in👉 https://www.nism.ac.in👉 https://www.amfiindia.com Strong Growth in SIF Assets Under Management (AUM) The popularity of Specialized Investment Funds continues to rise. According to recent industry data: Month AUM May 2026 ₹13,814 Crore June 2026 ₹17,858 Crore This represents a 29% month-on-month increase, highlighting growing investor interest in the newly introduced investment category. Benefits of the New Certification Framework The revised framework offers several advantages: Impact on Investors Although the changes primarily affect distributors, investors can also benefit through: Conclusion SEBI’s decision to introduce a single NISM certification for Specialized Investment Fund distributors marks another important step toward simplifying India’s investment distribution framework. By replacing the earlier dual-certification requirement with a unified qualification, the regulator has reduced compliance complexity while maintaining professional standards. As the Specialized Investment Fund industry continues to expand rapidly, this streamlined certification process is expected to encourage greater participation from distributors, improve investor access, and support the long-term growth of India’s asset management industry. Frequently Asked Questions (FAQs) 1. What is the new certification introduced by SEBI for SIF distributors? SEBI has introduced the NISM Series V-D – Mutual Fund – Specialized Investment Fund Distributors Certification, allowing distributors to sell both mutual funds and Specialized Investment Funds. 2. Is the NISM Series XIII Derivatives Certification still mandatory? No. The requirement will end after September 21, 2026. 3. Can existing distributors continue without the new certification? Yes. Existing distributors with a valid Series XIII certification obtained before September 21, 2026 can continue until their certification expires. 4. What happens after the Series XIII certificate expires? Distributors must obtain the NISM Series V-D certification to continue distributing Specialized Investment Funds. 5. Do mutual fund distributors need the new certification? Only if they intend to distribute Specialized Investment Funds (SIFs). Mutual fund-only distributors can continue with the NISM Series V-A certification.

Top 10 Technical Analysis Mistakes Beginners Make
Blog

Top 10 Technical Analysis Mistakes Beginners Make – Avoid These Costly Errors

Technical analysis is one of the most popular methods used by traders to analyze the stock market. Every day, thousands of beginners learn candlestick patterns, moving averages, RSI, MACD, chart patterns, and support & resistance, hoping to become consistently profitable. Yet, many still struggle to make money. The problem isn’t that technical analysis doesn’t work—it’s that most traders unknowingly make the same mistakes repeatedly. Poor chart reading, lack of discipline, and ignoring market context often lead to avoidable losses. If you’re just starting your trading journey, building a strong foundation is essential. Our Technical Analysis Course covers the core concepts every beginner should master before risking real capital. In this article, we’ll discuss the top 10 technical analysis mistakes beginners make, why they happen, and how you can avoid them to become a more disciplined trader. 1. Trading Against the Trend One of the biggest mistakes beginners make is trying to catch market tops and bottoms. For example, a stock has been rising for several weeks, but a trader assumes, “It has gone up too much—it has to fall now.” They short the stock, only to watch it continue climbing. Why it hurts Markets can remain in strong trends much longer than expected. Counter-trend trades generally have lower probabilities, especially for inexperienced traders. How to avoid it 2. Using Too Many Indicators Many beginners believe that adding more indicators improves accuracy. Their charts become crowded with RSI, MACD, Bollinger Bands, Stochastic Oscillator, ADX, and multiple moving averages. Why it hurts Too many indicators often provide conflicting signals, resulting in confusion and analysis paralysis. How to avoid it Keep your charts simple. A practical combination includes: Master these before exploring additional tools. 3. Ignoring Volume Price tells you what is happening. Volume often tells you how strong the move really is. Many beginners focus only on price action while completely ignoring trading volume. Why it hurts A breakout without strong volume may fail quickly, trapping buyers. Similarly, weak selling volume during a decline often indicates a lack of conviction. How to avoid it Always check volume during: Healthy price moves are usually supported by healthy volume. 4. Trading Only on Low Timeframes Many beginners spend hours analyzing 1-minute or 5-minute charts without ever checking the daily or weekly timeframe. Why it hurts Lower timeframes contain significant market noise. You may unknowingly trade against the larger trend. How to avoid it Use top-down analysis: This simple approach dramatically improves trading decisions. 5. Seeing Chart Patterns Everywhere After learning Head & Shoulders, Double Tops, Triangles, and Flags, beginners suddenly start seeing these patterns on every chart. The reality? Not every shape is a valid chart pattern. Why it hurts Forced patterns often fail because they lack proper structure and confirmation. How to avoid it Before trading a pattern, ask yourself: If the answer is no, skip the trade. 6. Drawing Trendlines and Support & Resistance Incorrectly Support and resistance are zones—not exact prices. Many traders force trendlines through candles or draw dozens of unnecessary levels. Why it hurts Poorly drawn levels often generate false entries and exits. How to avoid it Simple charts usually produce better decisions. 7. Trading Without a Stop-Loss Plan Entering a trade without knowing where you’ll exit if you’re wrong is one of the most expensive mistakes in trading. Why it hurts Without a predefined stop-loss, emotions take over. One bad trade can erase weeks of profits. How to avoid it Before entering any trade, identify your invalidation level. Ask yourself: “At what price is my trading idea no longer valid?” Place your stop-loss there—not based on hope, but based on chart structure. If you trade derivatives, understanding risk management is even more important. Our Options Trading Course teaches practical stop-loss and position-sizing techniques used by professional traders. 8. Ignoring Market Conditions No trading strategy works in every market. A breakout strategy performs differently in a trending market than it does in a sideways or highly volatile market. Why it hurts Applying the wrong strategy to the wrong market often results in repeated losses. How to avoid it Identify whether the market is: Trade only when your strategy matches the current market environment. 9. Confirmation Bias – Seeing What You Want to See Many traders decide what they want to buy first and then search for chart signals that support their opinion. Why it hurts You ignore warning signs and continue holding losing trades because you’re emotionally attached to your analysis. How to avoid it Create a written checklist before every trade. Include: If price proves your analysis wrong, exit the trade without hesitation. 10. Chasing the “Perfect” Setup Some traders wait until every indicator aligns perfectly before entering a trade. Unfortunately, perfect setups rarely exist. Why it hurts You either miss profitable opportunities or overcomplicate your trading system. How to avoid it Focus on: Remember: Consistency beats complexity. How to Avoid These Technical Analysis Mistakes Improving your trading isn’t about finding another indicator—it’s about building better habits. Follow this checklist: Once you’ve mastered the basics, you can expand your trading knowledge with our Advance Derivatives Course, designed to help traders understand futures, options, and advanced trading strategies. Conclusion: Clean Charts, Clear Rules, Better Results Most beginners don’t lose money because technical analysis is ineffective. They lose because they overcomplicate their charts, ignore trends, neglect risk management, and allow emotions to influence decisions. Technical analysis is simply a decision-making tool—not a guarantee of profits. By avoiding these common mistakes, simplifying your analysis, and following a disciplined trading plan, you’ll build a stronger foundation for long-term success. If you’re serious about becoming a consistently profitable trader, consider enrolling in ISFM’s Chartered Stock Trading Expert (CSTX) program. It combines technical analysis, derivatives, fundamental analysis, risk management, and live market training to help you trade with greater confidence. Remember: The best traders aren’t the ones with the most indicators—they’re the ones with the clearest rules and the discipline to follow them. Frequently Asked Questions (FAQs) 1. What is the biggest technical

Stock Market Career vs MBA
Blog

Stock Market Career vs MBA: Which Offers Better Growth in 2026?

Choosing a career after graduation is one of the biggest decisions you’ll make. For many students and young professionals in India, the dilemma often comes down to this: Should you pursue an MBA in Finance or build a career directly in the stock market? Both paths offer exciting opportunities, attractive salaries, and long-term career growth. However, they differ significantly in terms of cost, learning curve, income stability, career flexibility, and risk. If you’re confused between preparing for CAT/MAT and joining an MBA program or learning the stock market through professional courses and certifications, this guide will help you make an informed decision. What Does a Stock Market Career Really Mean? When people hear “stock market career,” they often think of day trading from home. In reality, the financial markets offer a wide range of professional careers beyond trading. Some popular roles include: Most professionals begin their journey by acquiring practical market knowledge through specialized courses, NISM certifications, internships, and hands-on market experience. Many also pursue globally recognized qualifications like CFA to strengthen their expertise. Enrolling in a Stock Market Course in Gurgaon can help beginners build practical skills, gain confidence, and prepare for professional roles in the financial markets. Unlike traditional degrees, stock market careers are highly skill-driven. Employers value your analytical ability, discipline, market understanding, and real-world performance more than theoretical knowledge alone. What Does an MBA in Finance Actually Offer? An MBA is a professional management degree designed to prepare students for leadership roles across industries. Although many students choose Finance as their specialization, an MBA covers much more than investing and stock markets. It includes subjects like: Graduates from reputed institutes often secure placements in: One of the biggest advantages of an MBA is its structured curriculum, strong alumni network, campus placements, and employer recognition—especially if earned from a reputed institution. Growth Factor #1: Time to Start Earning Stock Market Career One major advantage of this path is speed. Students can begin learning while still in college, complete certifications, secure internships, and start earning much earlier than MBA graduates. However, income during the initial phase may fluctuate because your growth largely depends on your skills, discipline, and performance. Courses like the Chartered Financial Market Expert (FMX) program are designed to help students become job-ready with practical exposure to financial markets. MBA Path An MBA generally requires: While graduates from top colleges often receive attractive salary packages, they begin their professional careers later than someone who entered the workforce directly. If becoming financially independent quickly is your priority, a market-focused career may offer an earlier start. Growth Factor #2: Cost and Risk Stock Market Career The overall investment is relatively lower. Instead of spending several lakhs on a degree, students can invest in: The real challenge is maintaining discipline. Relying solely on trading profits without proper education or risk management can be risky. Building a strong foundation before trading with real capital is always a better approach. MBA An MBA can cost anywhere from a few lakhs to over ₹25 lakhs depending on the institution. Besides tuition fees, students must also consider the opportunity cost of spending one or two years away from full-time employment. The return on investment depends heavily on the college’s reputation. Graduates from premier institutes often recover their investment quickly, whereas lower-tier colleges may not always justify the cost. Growth Factor #3: Income Potential and Career Growth Stock Market Careers Income in financial markets is largely performance-driven. Professionals working in: can build highly rewarding careers over time. There is no fixed income ceiling. Experienced traders, analysts, and fund managers can earn substantial incomes, but success requires consistency, patience, and continuous learning. MBA Careers MBA graduates usually enjoy a more structured salary progression. Corporate promotions, annual increments, leadership roles, and management positions provide a relatively predictable growth path. Graduates from premier business schools may enter investment banking, consulting, or senior finance roles with impressive compensation packages. Ultimately, long-term income depends far more on your expertise, adaptability, and performance than on the qualification alone. Growth Factor #4: Skill Set and Career Flexibility Stock Market Path This route develops specialized expertise in: Developing these skills through a professional Technical Analysis Course can significantly improve your understanding of price action, chart patterns, trend analysis, and trading strategies used by professional market participants. MBA Path An MBA develops broader business capabilities, including: If your interests evolve over time, an MBA makes it easier to switch industries or move into management positions. If you’re completely passionate about financial markets, specialized education may offer faster career growth. If you’re still exploring your interests, an MBA provides greater flexibility. Growth Factor #5: Lifestyle and Stress Both careers involve pressure—but in different ways. Stock Market Professionals Market-related careers often involve: Research and wealth management roles may offer relatively balanced work-life routines compared to active trading. MBA-Based Corporate Roles Corporate careers generally provide: However, sectors like investment banking and consulting are also known for demanding schedules. Think carefully about the kind of work environment that matches your personality and career goals. Who Should Choose Which Path? Consider a Stock Market Career if: Consider an MBA if: The Hybrid Approach Many successful professionals combine both paths. You can begin learning financial markets during graduation, gain practical experience, work in the industry, and later pursue an MBA if you wish to move into leadership or corporate management. Starting with an Options Trading Course allows you to build practical market exposure while keeping your future career options open. Conclusion: Growth Is About You, Not Just the Label There is no universal answer to the question, “Stock Market Career vs MBA: Which Offers Better Growth in 2026?” The right choice depends on your interests, financial situation, career aspirations, and willingness to learn. A stock market career rewards practical skills, discipline, and consistent performance, while an MBA offers structured learning, broader career opportunities, and valuable professional networks. In the long run, continuous learning, adaptability, integrity, and real-world expertise matter far more than the title on your resume. Whether

Ashish Kacholia: Strategy & Success Story of India’s “Big Whale”
Blog

Ashish Kacholia: Strategy & Success Story of India’s “Big Whale”

Ashish Kacholia is one of India’s most respected stock market investors, widely recognized as the “Big Whale of Dalal Street.” While many investors chase popular large-cap stocks, Kacholia built his reputation by identifying promising small- and mid-cap companies before they became market favorites. Over the years, his publicly disclosed portfolio has grown into several thousand crores, making him a role model for long-term investors. Unlike traders who seek quick profits, Ashish Kacholia believes in patient investing backed by deep research. His journey offers valuable lessons for anyone looking to build long-term wealth in the stock market. In this article, we’ll explore his career, investment philosophy, portfolio style, and the principles that have made him one of India’s most successful investors. Related Read: Stock Market Career vs MBA: Which Offers Better Growth in 2026? Who is Ashish Kacholia? Ashish Kacholia is a renowned Indian investor known for spotting multibagger opportunities in under-researched companies. Rather than investing in already popular businesses, he looks for companies with strong fundamentals, capable management, and scalable business models that can grow significantly over time. His investment style focuses on identifying businesses at an early stage of growth and holding them patiently for years, allowing the power of compounding to generate exceptional returns. Early Life and Career: From Finance Professional to Full-Time Investor Ashish Kacholia graduated as an engineer before entering the financial markets. He began his career through roles at firms such as Prime Securities, where he gained practical exposure to equity markets and company analysis. Like many successful investors, he did not begin with enormous wealth. His portfolio grew gradually through disciplined investing, continuous learning, and years of experience. Instead of relying solely on short-term trading, he shifted his focus toward long-term portfolio investing, particularly in emerging small- and mid-cap businesses. His transition from market participant to respected investor demonstrates that consistent discipline often matters more than starting capital. The Turning Point: Building a Multibagger Portfolio One of the defining characteristics of Ashish Kacholia’s investing journey is his focus on businesses that the broader market has yet to fully appreciate. He generally looks for companies that possess: Rather than chasing momentum, he is comfortable holding investments for three to five years—or even longer—allowing businesses sufficient time to deliver sustained growth. Ashish Kacholia’s Investment Strategy His investment philosophy revolves around a few simple yet powerful principles. 1.) Deep Research Ashish Kacholia is known for conducting detailed company research. Before investing, he studies financial statements, industry trends, management quality, and price behaviour. Investors who wish to strengthen their market analysis skills can benefit from learning Technical Analysis, which helps identify trends and improve decision-making. 2.) Focus on Small and Mid Caps Small- and mid-cap companies often receive less analyst coverage than large-cap firms. This creates opportunities to discover quality businesses before institutional investors notice them. 3.) Growth at a Reasonable Price (GARP) Rather than buying expensive “story stocks,” he looks for companies where earnings growth justifies the valuation. This disciplined approach reduces the risk of overpaying. Similarly, traders who understand risk management often use strategies such as the Bull Put Spread in moderately bullish markets instead of taking unnecessary risks. 4.) Long-Term Perspective Frequent buying and selling rarely forms part of his strategy. Patience is one of his biggest competitive advantages. Diversified Yet Conviction-Based Portfolio His portfolio generally contains 40–50+ companies spread across different sectors while maintaining meaningful allocations to high-conviction ideas. A Glimpse Into His Portfolio Style Although Ashish Kacholia’s holdings evolve over time, his portfolio often includes companies from sectors such as: One notable feature of his investing style is entering businesses early in their growth journey. As companies mature or valuations become expensive, he may rebalance or reduce exposure. It is important to remember that disclosed portfolios represent investments made after extensive research and often years before becoming public information. Investors should avoid blindly copying holdings and instead focus on understanding the underlying businesses. Multibagger Success Stories Several successful investments have been associated with Ashish Kacholia over the years. 1.) Safari Industries Safari Industries benefited from rising demand for branded luggage in India. Strong management execution, increasing consumer spending, and brand expansion contributed to its long-term growth. Patient investors who stayed invested despite market fluctuations benefited from the company’s business expansion. 2.) Xpro India Xpro India emerged as a significant wealth creator as its specialty manufacturing business gained momentum. Industry tailwinds and operational improvements supported the company’s long-term growth story. 3.) Sectoral Success Ashish Kacholia has consistently identified opportunities across sectors such as: These examples illustrate his investment process rather than serving as stock recommendations. Key Lessons for Everyday Investors Every investor can learn valuable lessons from Ashish Kacholia’s journey. Myths vs Reality Conclusion: What You Can Copy (and What You Shouldn’t) Ashish Kacholia’s success story demonstrates that extraordinary wealth creation is possible through deep research, disciplined investing, and long-term thinking. His focus on small- and mid-cap companies, combined with careful business analysis and patience, has enabled him to identify several multibagger opportunities over the years. However, investors should resist the temptation to simply copy his portfolio. Public disclosures often reflect investments made years earlier and may not suit every investor’s financial goals or risk tolerance. Whether you’re inspired by Ashish Kacholia or any other successful investor, remember that consistent learning matters more than copying portfolios. Building knowledge through structured Stock Market Courses and disciplined investing can significantly improve your long-term decision-making and confidence in the markets. Learn more about ISFM’s complete range of Stock Market Courses Frequently Asked Questions (FAQs) Is Ashish Kacholia a trader or an investor? He is primarily known as a long-term equity investor, although he has extensive market experience. Why is Ashish Kacholia called the “Big Whale of Dalal Street”? He earned this title because of his remarkable ability to identify promising small- and mid-cap companies before they became widely recognized, creating significant long-term wealth. Can investors copy Ashish Kacholia’s portfolio? No. Investors should use his portfolio as a learning resource rather than blindly replicating his holdings. Every

FOMO in Trading
Blog

FOMO in Trading: How Fear of Missing Out Destroys Traders (and How to Stop It)

Have you ever watched a stock, crypto coin, or option skyrocket while your social media feed filled with screenshots of huge profits? Suddenly, you feel like you’re the only one not making money. Your heart starts racing, and you think, “If I don’t buy now, I’ll miss the opportunity forever.” That feeling is called FOMO (Fear of Missing Out), and it’s one of the biggest reasons traders lose money. FOMO in trading is the emotional urge to enter a trade simply because others appear to be profiting. Instead of following a strategy, traders let emotions take control. Learning proper market analysis through a Share Market Course can help traders make informed decisions rather than emotional ones. In this article, you’ll learn what FOMO really is, why it’s dangerous, and how to overcome it with disciplined trading habits. What Does FOMO in Trading Really Look Like? FOMO doesn’t always feel obvious. It often disguises itself as confidence or urgency. Here are some common examples: The truth is, FOMO isn’t caused by the market. It’s driven by comparison, impatience, and the fear of being left behind. To avoid emotional entries, traders should first understand chart patterns, trends, and price action through a Technical Analysis Course, which teaches traders to rely on data instead of emotions. Why FOMO Is So Dangerous for Traders FOMO can quietly destroy both your trading account and your confidence. 1. You Buy Near the Top Most traders who experience FOMO enter after a large price move has already happened. By then, professional traders may already be taking profits. 2. You Take Bigger Risks Instead of following proper position sizing, traders often risk more money hoping to “catch up.” This increases losses when the trade goes wrong. 3. You Lose Confidence A FOMO trade often ends in disappointment. Instead of learning from the mistake, many traders immediately chase another opportunity, creating a dangerous cycle: See profits → Chase trade → Lose money → Feel frustrated → Chase another trade Developing a disciplined trading mindset through structured education is often far more valuable than chasing the next hot stock tip. Signs You’re Trading with FOMO Ask yourself these questions: If you answered “yes” to several of these, FOMO may be influencing your decisions. Remember, recognizing the problem is the first step toward fixing it. Why Our Brain Falls for FOMO FOMO isn’t a weakness—it’s part of human psychology. Herd Behaviour People naturally feel safer doing what everyone else is doing. In financial markets, this often leads to buying after prices have already surged. Loss Aversion Psychologically, missing a profit feels almost like taking a loss. That emotional discomfort pushes traders into poor decisions. Social Proof When traders post winning trades online, it creates the illusion that everyone is making money except you. What you don’t see are the losses they never share. Ironically, markets often attract the largest number of emotional buyers near the end of a strong rally. Practical Ways to Beat FOMO in Trading 1. Create a Written Trading Plan Your trading plan should clearly define: Only take trades that match your plan—nothing else. If you actively trade derivatives, having predefined rules is essential. A professional Options Trading Course can help you develop a disciplined, strategy-driven approach. 2. Limit Market Noise Social media can be helpful, but it can also create unnecessary pressure. Instead of constantly checking Telegram groups or viral posts: Less noise means better decisions. 3. Decide Risk Before Entering Professional traders decide their risk before entering a trade. Never increase your position simply because others are making money. A good rule is to risk only a small percentage of your trading capital on any single trade. 4. Delay Emotional Decisions Whenever you feel an urgent need to buy immediately, pause. Wait: Many emotional trades disappear once the excitement fades. 5. Maintain a FOMO Journal Keep a separate journal for emotional trades. Record: After a month, you’ll notice repeating patterns that can dramatically improve your discipline. Many successful traders also use algorithmic trading strategies to remove emotional decision-making from their trading process. Learning the basics through an Algo Trading Course can help traders understand how rule-based systems eliminate emotional bias. Turning FOMO into a Trading Edge Experienced traders don’t just manage their own emotions—they observe the emotions of others. When everyone suddenly becomes excited about one stock, it often signals that the move is already mature. This doesn’t mean you should automatically trade against the crowd. Instead, use market sentiment as one additional piece of information alongside technical analysis, volume, and risk management. If you’re aiming to build long-term trading discipline and professional skills, consider enrolling in the Chartered Stock Trading Expert (CSTX) program, where trading psychology, technical analysis, and risk management form the foundation of every trading decision. Before entering any trade, ask yourself: “If I hadn’t seen anyone else’s profits, would I still take this trade?” If the answer is no, you’re probably reacting emotionally rather than strategically. Conclusion: Choose Discipline Over Hype FOMO is completely normal. Every trader experiences it at some point. The difference between successful and unsuccessful traders isn’t the absence of emotion—it’s the ability to manage it. The market will always provide another opportunity. There will always be another breakout, another rally, and another trending stock. Your goal isn’t to catch every move. Your goal is to protect your capital, continuously improve your knowledge, and consistently follow your trading plan. “In trading, missing one move is normal; missing your rules is what truly costs you.”

Iron Condor Strategy
Blog

Iron Condor Strategy: Defined-Risk Range Strategy for Indian Options Traders

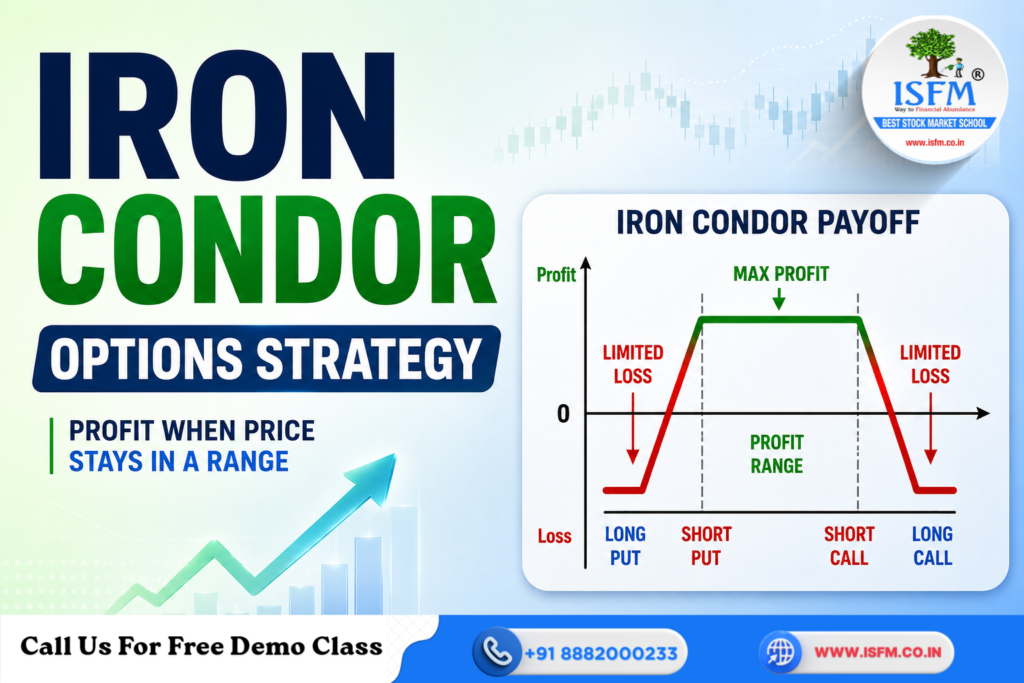
In the Indian stock market, there are many phases when indices like Nifty or Bank Nifty move sideways instead of trending strongly. During such periods, directional trades often fail, but option premium-selling strategies can perform exceptionally well. One such powerful approach is the Iron Condor strategy—a neutral, defined-risk options strategy designed for traders who expect the market to stay within a range. If you are new to options strategies, it’s recommended to first understand the basics through a structured options trading course. What is Iron Condor Strategy? The Iron Condor is a combination of two spreads: This creates a four-leg strategy where you: The goal is simple: Earn premium while the market stays between the two sold (inner) strikes. How Iron Condor Works (Short Call Spread + Short Put Spread) The strategy profits from time decay (theta) and low volatility. This makes Iron Condor a defined risk NSE strategy, unlike naked short straddles or strangles. For deeper understanding of such combinations, traders often explore advanced derivatives training. Why Use This Defined-Risk Neutral Strategy? Iron Condor is widely used because it offers: For traders focusing on consistency, structured learning like a stock trading course helps in mastering such setups. Setup: Strike Selection, Spread Width & Expiry A successful Nifty Iron Condor setup depends on proper planning: 1. Strike Selection (OTM Wings) 2. Spread Width 3. Expiry Choice Step-by-Step Numerical Example Let’s assume: Nifty spot = 24,000 Trade Setup: Premium Received: Key Levels: Payoff at Expiry: Nifty Price Outcome 23,600 Max Loss 23,800 Breakeven 24,000 Max Profit 24,200 Breakeven 24,400 Max Loss This clearly shows how the neutral premium strategy earns when price stays within the inner range. Real-World Indian Market Scenario Imagine Nifty trading between 23,900–24,200 for several sessions due to: In such a case, directional trades struggle, but an Iron Condor India setup works efficiently by capturing time decay. Unlike a short strangle: This makes it ideal for disciplined traders. When to Use Iron Condor in Indian Markets Best conditions: Avoid using it during: Key Risks and Management Techniques Risks: Management Techniques: To master risk management professionally, traders often choose mentorship-based programs like the Chartered Stock Trading Expert Course. When to Exit the Position Smart traders don’t wait till expiry every time. Exit when: Quick Recap and Takeaway If used with discipline, Iron Condor can become a consistent income strategy for Indian traders.

Scroll to Top