A company’s share price may rise because of positive news, market sentiment, or strong quarterly results. However, its annual report reveals deeper insights into profitability, debt, cash flow, and corporate governance. For investors analysing NSE-listed companies, understanding annual report red flags is essential for effective fundamental analysis.
According to Sushil Alewa, SEBI Registered Research Analyst (INH100009433), investors should look beyond reported profits and examine the financial patterns that reveal a company’s actual business performance. An annual report should be analysed through its income statement, balance sheet, cash-flow statement, notes to accounts, and auditor’s report.
A red flag does not prove fraud or business failure. It signals the need for further investigation.
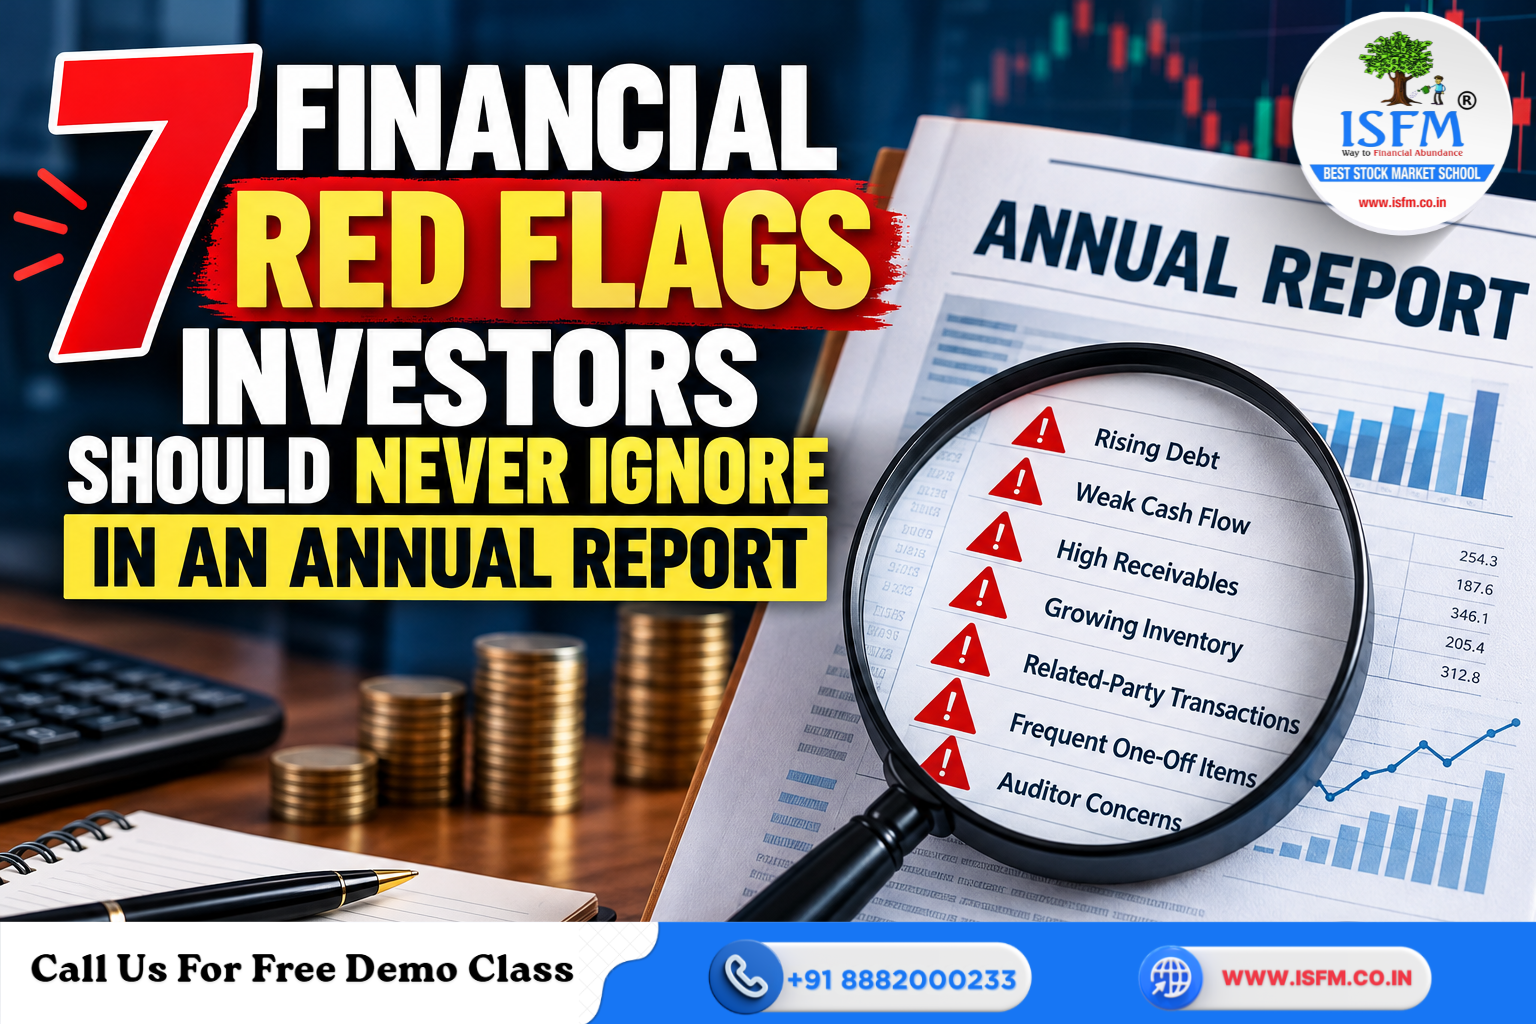
1. Profit Without Cash Flow
Reported profit is not the same as cash received. A company may report rising net profit while generating weak or negative operating cash flow because customers delay payments or working-capital requirements increase.
Compare operating cash flow with net profit over five years. A persistent gap may indicate weaker earnings quality and deserves investigation.
To understand financial statement analysis in greater depth, explore ISFM’s Fundamental Analysis Course.
2. Receivables Growing Faster Than Revenue
Trade receivables represent money customers owe for goods or services already supplied.
For example, if revenue rises 20% but receivables increase 60%, collections may be slowing or credit sales may be growing disproportionately. Rising debtor days and provisions for doubtful debts deserve attention.
Compare receivables growth, revenue growth, and collection periods before drawing conclusions.
3. Inventory Building Faster Than Sales
Inventory includes raw materials, work-in-progress, and finished goods. Rapid inventory growth alongside sluggish sales may indicate weakening demand, inefficient production, or unsold products.
Declining inventory turnover and repeated stock write-downs are additional warning signs. However, seasonal demand and planned expansion can also explain higher inventory.
4. Rising Debt and Weak Repayment Capacity
Borrowing can support expansion, but excessive debt becomes risky when cash generation cannot cover interest and repayments.
Examine total borrowings, short-term liabilities, interest coverage, debt-to-equity, and upcoming maturities. Significant repayments within twelve months, combined with limited cash, may create liquidity pressure.
Assess whether borrowing finances productive growth or recurring operating losses. Investors interested in market behaviour can also explore ISFM’s Technical Analysis Course.
5. Frequent “One-Off” Items
Exceptional expenses, restructuring charges, and asset impairments can legitimately occur. However, repeated supposedly exceptional losses may indicate persistent operational problems.
Similarly, profits heavily dependent on asset sales or other income may overstate the strength of core operations. Compare operating profit and exceptional items across several years.
6. Related-Party Transactions
These transactions involve promoters, directors, subsidiaries, associates, or connected entities. They may be legitimate, but large loans, unclear pricing, persistent outstanding balances, or transactions lacking commercial justification deserve scrutiny.
Read the notes to accounts to understand transaction values, business purposes, repayment terms, and outstanding balances.
7. Auditor Concerns and Accounting Changes
The auditor’s report provides an independent opinion on whether financial statements present a true and fair view under applicable accounting standards.
Warning signs include qualified or adverse opinions, auditor resignations, going-concern concerns, restated financial statements, and frequent accounting-policy changes. Investigate material qualifications and explanations rather than assuming misconduct.
How to Investigate Financial Red Flags
Before making an investment decision:
- Compare five-year financial trends and industry peers.
- Read management commentary and notes to accounts.
- Compare cash flow with reported profit.
- Review debt maturities and interest expenses.
- Examine related-party disclosures and the auditor’s report.
- Determine whether the issue is temporary, cyclical, or structural.
Investors seeking to understand derivatives and market risk can explore ISFM’s Options Trading Course or Advanced Derivatives Course. Those interested in systematic market strategies may also consider the Algo Trading Course.
Frequently Asked Questions
1. What are financial red flags in an annual report?
They are warning signs of potential financial weakness, poor earnings quality, or governance concerns.
2. Is rising debt always bad?
No. Debt can finance growth, but inadequate cash flow to service it increases risk.
3. Do auditor qualifications prove fraud?
No. They identify concerns that investors should investigate further.
4. How should investors investigate a red flag?
Compare historical performance, industry peers, financial disclosures, and management explanations before deciding.
Conclusion
Annual reports reveal how companies earn, spend, borrow, and manage risks. Careful analysis helps investors make more informed decisions.
“A red flag does not tell you to sell immediately. It tells you to slow down, investigate the pattern, and understand whether the business is facing a temporary problem or a structural weakness.”
Disclaimer: This article is for educational purposes only and is not investment advice or a recommendation to buy or sell securities. Conduct independent research before making investment decisions.