
A company can report strong profits and still have financial weaknesses hidden beneath the surface. Rising debt, slow customer payments or excessive inventory can create problems that are not obvious from the share price. That is why professional investors study the balance sheet before investing.
According to Sushil Alewa, SEBI Registered Research Analyst (INH100009433), with practical experience in stock market analysis and investor education helps investors understand financial statements and make decisions based on business fundamentals rather than market noise.
What Is a Balance Sheet?
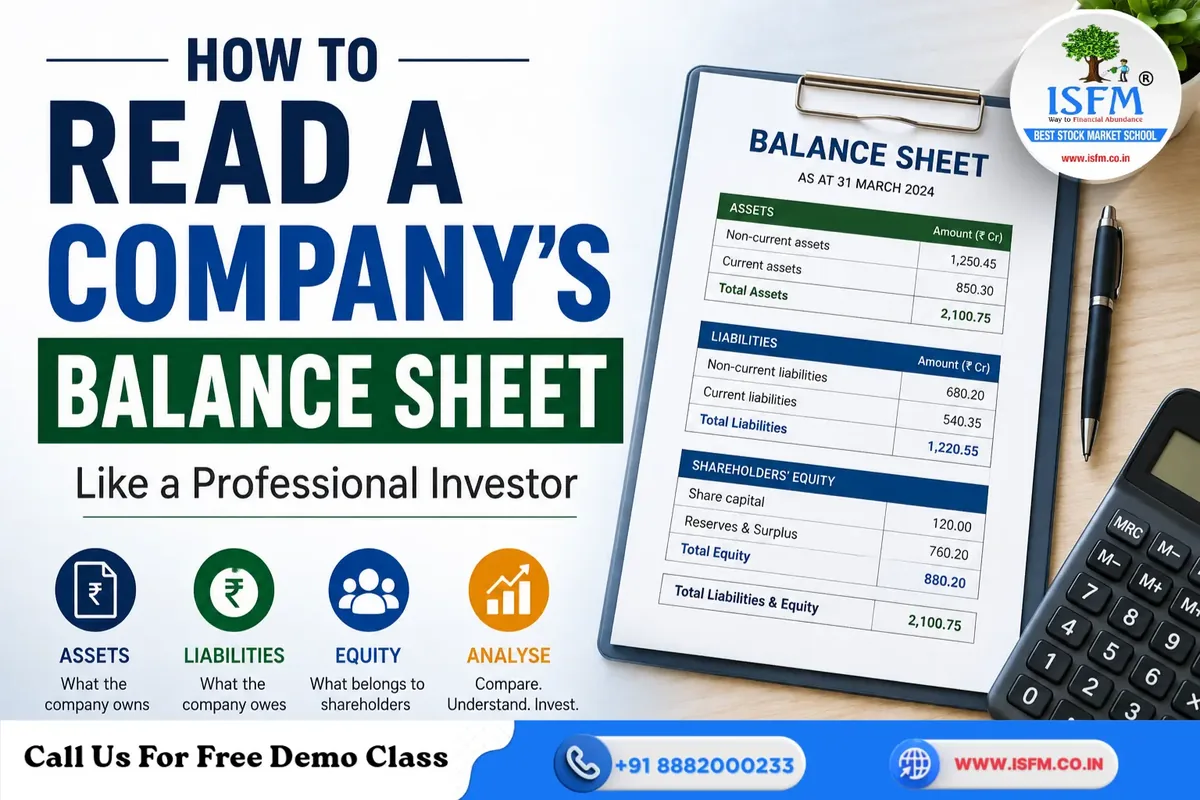
A balance sheet is a snapshot of a company’s financial position on a particular date. It tells investors what the company owns, what it owes and what belongs to shareholders.
The basic accounting equation is:
Assets = Liabilities + Shareholders’ Equity
Assets include cash, receivables, inventory, property and investments. Liabilities include loans, supplier dues and other obligations. Shareholders’ equity represents the residual value attributable to shareholders.
If you want to develop a stronger foundation in fundamental analysis, explore ISFM’s Chartered Stock Trading Expert Course.
Step 1: Check the Date and Numbers
Before analysing anything, check the reporting period and units. Figures may be presented in rupees, lakhs or crores.
Then compare the current balance sheet with previous years. A single number tells you very little; the trend often tells the real story.
Step 2: Analyse the Assets
Start by asking: Where is the company’s money invested?
- Cash: Is cash increasing, and is it supported by operating cash flow?
- Trade receivables: If receivables grow much faster than sales, customers may be taking longer to pay.
- Inventory: Rising inventory can support expansion, but excessive growth could indicate weak demand or obsolete stock.
- Property and equipment: Increasing investment in productive assets can be positive if it generates higher revenue and profits.
Also examine goodwill, investments and intangible assets. The professional investor asks not only “What increased?” but “Why did it increase?”
Step 3: Examine Debt and Liabilities
Separate short-term liabilities from long-term borrowings. Look at total debt, short-term debt, lease liabilities, trade payables, provisions and contingent obligations.
A useful calculation is:
Net Debt = Total Debt − Cash
Debt itself is not necessarily bad. Borrowing can help a profitable company expand. The warning sign is debt increasing faster than revenue and cash generation.
Always compare debt with similar companies because acceptable leverage varies considerably between industries.
Step 4: Study Shareholders’ Equity
Check share capital, reserves and retained earnings.
Is shareholders’ equity growing because the business is generating profits, or because the company is issuing new shares?
Frequent fundraising can dilute existing shareholders. Investors should also watch for shrinking or negative net worth.
For investors wanting to learn how to analyse a company before investing, ISFM’s Stock Market Investment Course offers a structured learning framework.
Step 5: Understand Working Capital
Working capital is:
Current Assets − Current Liabilities
Pay attention to receivable days, inventory days and payable days.
For example, suppose sales increase by 20%, but receivables increase by 60%. That deserves investigation. Customers may be taking longer to pay, creating pressure on cash despite reported profits.
This is why balance sheet analysis should always be connected with the cash-flow statement.
Step 6: Use Key Ratios
Important ratios include:
- Debt-to-Equity: Total Debt ÷ Shareholders’ Equity
- Current Ratio: Current Assets ÷ Current Liabilities
- Quick Ratio: (Current Assets − Inventory) ÷ Current Liabilities
- Net Debt-to-EBITDA: Measures debt relative to operating earnings
- Asset Turnover: Revenue ÷ Average Total Assets
Do not judge these ratios using universal rules. Compare them with the company’s historical performance and industry peers.
Step 7: Read the Notes to Accounts
Some of the most important information may be hidden in the notes.
Look for contingent liabilities, related-party transactions, pledged assets or shares, guarantees, accounting-policy changes and off-balance-sheet commitments.
Never rely only on a summary website or a single financial ratio.
Balance Sheet Red Flags
Watch for:
- Debt rising while cash flow weakens
- Receivables or inventory growing much faster than sales
- Frequent equity dilution
- Shrinking or negative net worth
- Large unexplained “other assets”
- Significant related-party transactions
- Repeated auditor changes
- Large contingent liabilities
- Profits without matching operating cash flow
Connect the Financial Statements
A balance sheet should be analysed alongside the profit-and-loss statement, cash-flow statement, annual report and management discussion.
For example, rising profits become more convincing when operating cash flow is also healthy, receivables are controlled and debt remains manageable.
Conclusion
Professional investors do not simply ask what changed on a balance sheet—they ask why it changed.
A practical approach is to check the accounting equation, compare multi-year trends, study cash and debt, examine working capital, calculate important ratios and carefully read the notes to accounts.
A strong balance sheet does not guarantee a good investment, but a weak one can warn you before the market does.