• Home
  • Courses
    • Share Market
      • One To One Mentorship
      • Chartered Stock Trading Expert
      • Technical Analysis Course
      • Advance Derivatives Course
      • Fundamental Analysis Course
      • Options Trading Course
      • Stock Market Astrology
      • Algo Trading Course
      • Diploma in Stock Trading
      • Commodity Trading Course
      • Currency Trading Course
      • Arbitrage Trading Course
    • Career Oriented
      • Chartered Financial Market Expert- FMX
      • NISM Certifications Training
      • Mutual Fund Certification
      • Certified Financial Planner – CFP
      • Diploma in Banking & Finance
    • Wealth Management
      • BASIC
  • Online Courses
    • Technical Analysis Course Full
    • Professional Trading Setups
    • Candlestick Bible Course
  • About Us
    • Know Your Mentors
    • Group Company
  • Investors Education
    • SEBI / NISM Free Educational Material
    • Financial Abundance
    • Free Financial Literacy Seminar
    • Important Links
  • Trading School
    • Live Stock Selection Sheet
    • Options Trading School
    • Trading Tools Kit
  • Training Partner
    • Training Partner Form
    • Franchise
  • Placement
  • Contact
  • Blog
  • +91 8920620024
  • (+91) 8168573253
  • (+91) 9310231337
  • [email protected]
  • Online Class
Facebook Twitter Linkedin Instagram Youtube
Free Demo
ISFM
  • Home
  • Courses
    • Share Market
      • One To One Mentorship
      • Chartered Stock Trading Expert
      • Technical Analysis Course
      • Advance Derivatives Course
      • Fundamental Analysis Course
      • Options Trading Course
      • Stock Market Astrology
      • Algo Trading Course
      • Diploma in Stock Trading
      • Commodity Trading Course
      • Currency Trading Course
      • Arbitrage Trading Course
    • Career Oriented
      • Chartered Financial Market Expert- FMX
      • NISM Certifications Training
      • Mutual Fund Certification
      • Certified Financial Planner – CFP
      • Diploma in Banking & Finance
    • Wealth Management
      • BASIC
  • Online Courses
    • Technical Analysis Course Full
    • Professional Trading Setups
    • Candlestick Bible Course
  • About Us
    • Know Your Mentors
    • Group Company
  • Investors Education
    • SEBI / NISM Free Educational Material
    • Financial Abundance
    • Free Financial Literacy Seminar
    • Important Links
  • Trading School
    • Live Stock Selection Sheet
    • Options Trading School
    • Trading Tools Kit
  • Training Partner
    • Training Partner Form
    • Franchise
  • Placement
  • Contact
  • Blog

    Blog

    • Home
    • Blog
    • Blog
    • Hanging Man Candlestick Pattern: A Warning Sign for Traders
    Hanging Man Candlestick Pattern: A Warning Sign for Traders

    • Posted by Mr. Sushil Alewa
    • Categories Blog
    • Date April 29, 2025
    • Comments 0 comment
    B-638 What is Hanging man candlestick pattern_WWW.ISFM.CO.IN

    In the world of technical analysis, candlestick patterns help traders make informed decisions by revealing market psychology. One of the most reliable bearish reversal indicators at the top of an uptrend is the Hanging Man candlestick pattern.

    If you’re trading in an overbought market or suspect a trend is losing steam, spotting a Hanging Man can save you from major losses—or even help you profit from reversals.

    In this blog, we’ll cover:

    • What is a Hanging Man pattern
    • How it forms and how to identify it
    • Key trading strategies
    • Where to place stop loss
    • Pros and cons of using this setup
    • Where to master these patterns with live coaching

    What is a Hanging Man Candlestick?

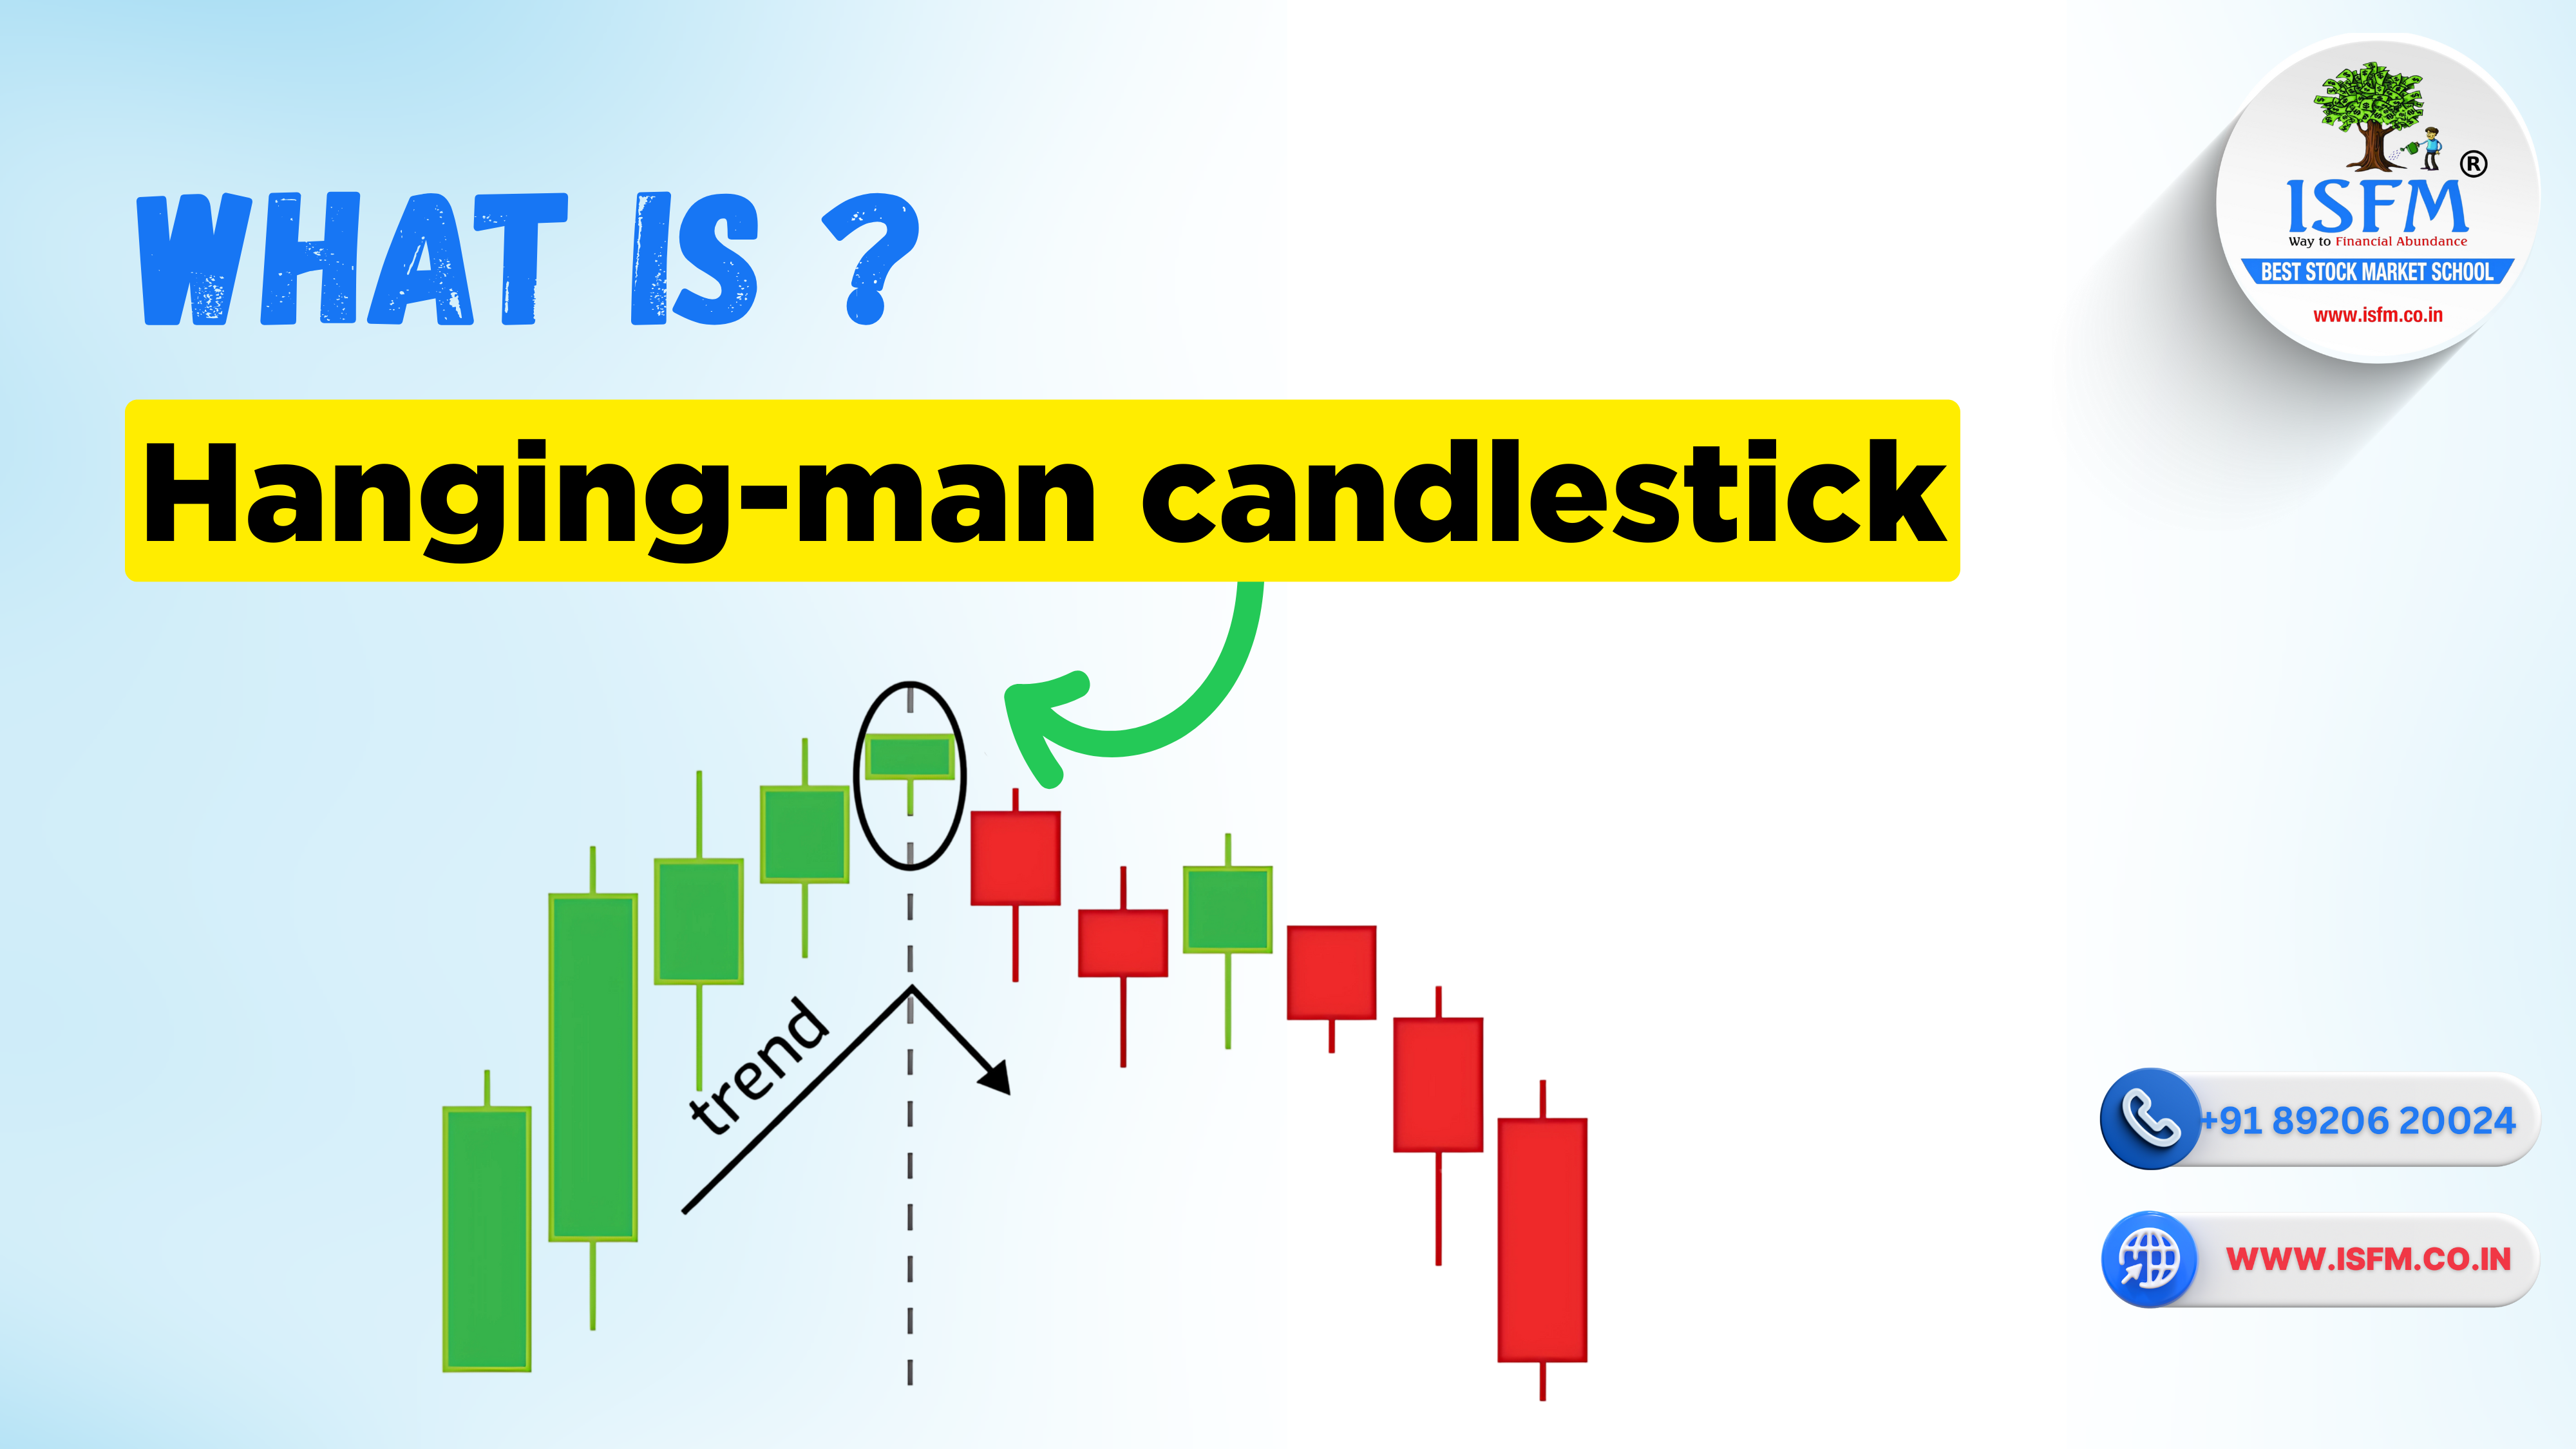
    The Hanging Man is a single-candle bearish reversal pattern that appears after a strong uptrend. It looks just like a Hammer but appears at the top, not the bottom.

    Key Characteristics:

    • Small real body at the top of the range
    • Long lower shadow (at least 2x the body)
    • Very little or no upper shadow
    • Appears after a bullish rally

    It reflects weakening buyer strength and the possible entry of sellers.

    How Does the Hanging Man Form?

    1. After a strong uptrend, bulls open the candle higher
    2. During the session, sellers push prices down significantly
    3. By the end, bulls recover some ground, but fail to close strong
    4. This results in a small body with a long lower wick—a clear sign of buying pressure fading

    It’s a sign that sellers are testing the waters—and bulls are starting to tire.

    How to Identify a Hanging Man?

    Use the following checklist to spot a true Hanging Man:

    ✅ Appears after a noticeable uptrend
    ✅ Small real body at the top of the range
    ✅ Long lower shadow (at least twice the body)
    ✅ Little or no upper wick
    ✅ Ideally confirmed with next bearish candle or high volume

    Learn how to read patterns like this inside our Technical Analysis Course.

    How to Trade the Hanging Man Pattern?

    Entry Strategy:

    • Wait for the next candle to break below the low of the Hanging Man
    • Confirm with volume spike or bearish RSI divergence

    Stop Loss:

    • Place stop loss above the high of the Hanging Man candle

    Target:

    • Previous support level or
    • Use Fibonacci retracement levels or moving averages as dynamic targets

    We cover this trading logic live in our CSTX – Chartered Stock Trading Expert Course

    Pros and Cons of Hanging Man Pattern

    Pros:

    • Easy to spot visually
    • Great early warning signal for trend reversal
    • Can be highly accurate with volume confirmation

    Cons:

    • Needs confirmation from the next candle
    • May produce false signals in sideways markets
    • Not useful in isolation—requires context (trend + volume)

    Master Candlestick Trading with ISFM

    To become a consistently profitable trader, you need more than just theory—you need practical, live experience with candlestick setups like Hanging Man, Doji, Shooting Star, and more.

    🔗 Our Best Courses for This:

    📘 Technical Analysis Course – Online/Offline
    📘 Chartered Stock Trading Expert (CSTX)
    📘 Stock Trading Courses for Beginners & Professionals

    ✅ One-on-One Mentorship
    ✅ NISM Certification Guidance
    ✅ Free Study Material & Backup Recordings
    ✅ 100% Placement Assistance

    📍 Sector-38, Medicity Road, Gurgaon
    📞 Call Now: +91 8882000233 | +91 8168573253
    🌐 Visit: www.isfm.co.in

    Conclusion

    The Hanging Man is a simple yet powerful candlestick pattern that signals trend exhaustion and possible reversal. When used in the right context, it can help you exit long trades early or prepare for short entries with low risk. 🚀 Want to learn candlestick patterns in live markets? Join ISFM – India’s Best Stock Market School and turn your trading passion into profit!

    Mr. Sushil Alewa

    Mr. Sushil Alewa (SEBI Registered Research Analyst, MBA, CFP ) having 12 year work experience in Trading, Training, and consultancy in the area of Securities / Financial Market mainly Investment management
    industry, Technical Analysis of Stock Market.
    He is Empanelled as 'Certified Trainer of Financial Education with SEBI & IICA - MCA (Securities & Exchange Board of India), the regulating authority, Govt. of India for the securities market; Involved in conducting workshops on 'Financial Literacy to various groups such as students, company executives, middle-income groups etc. Have individually conducted more than 1600+ Investor Awareness workshops on financial literacy in the last 10 years, with reputed Universities, management colleges, corporate houses and top schools.

    Previous post

    How to Make Money in Intraday Trading: Strategies, Features, and Benefits & Challenges
    April 29, 2025

    Next post

    Shooting Star Candlestick Pattern: Spotting Bearish Reversals Before They Drop
    April 29, 2025

    You may also like

    Top-5-NISM-Certifications
    Top 5 NISM Certifications for Beginners: Start Your Financial Market Career Today
    2 May, 2025
    three white soldiers candlestick pattern
    Three White Soldiers Candlestick Pattern: Spot the Beginning of a Bullish Trend
    1 May, 2025
    op 5 bullish candlestick pattern
    Top 5 Bullish Candlestick Patterns Every Trader Must Know
    1 May, 2025

    Leave A Reply Cancel reply

    Your email address will not be published. Required fields are marked *

    Popular Courses

    Diploma in Stock Trading

    Diploma in Stock Trading

    ₹60,000.00 ₹40,000.00
    Chartered Stock Trading Expert

    Chartered Stock Trading Expert

    ₹60,000.00 ₹50,000.00
    Chartered Financial Market Expert- FMX

    Chartered Financial Market Expert- FMX

    ₹80,000.00 ₹60,000.00

    Latest Posts

    impact of Union Budget on the Stock Market
    Impact of the Union Budget 2024 on the Stock Market: Key Highlights
    23Jul2024
    impact of Union Budget on the Stock Market
    ISFM – Best Stock Market Training School – Gurgaon is looking for Trainer Empanelment at pan India level
    04Feb2023
    Pre Budget Rally Stocks
    Pre Budget Rally Stocks 2021
    20Oct2022

    Subscribe our Newsletter

    About ISFM

    ISFM has become a center for excellence of  stock market training in Gurgaon, Delhi / NCR. We have a very well designed 6 stage wise courses on securities market which covers from Equity, Derivatives, Commodity, Currency, Mutual Funds and Technical Analysis. 

    Company
    • Blog
    • About Us
    • Contact
    • Become a Trainer
    Quick Links
    • All Courses
    • Option Trading School
    • Free Literacy Workshop
    • Study Material
    • Other Links International
    • Other Links Local
    Edit widget and choose a menu
    Contact Us
    • 0124-2200689
    • (+91) 8168573253
    • (+91) 9310231337
    • (+91) 7015237224
    • Email: [email protected]
    Recent Post
    Top-5-NISM-Certifications

    Top 5 NISM Certifications for Beginners: Start Your Financial Market Career Today

    May 2, 2025

    ISFM PVT. LTD © 2025. All Rights Reserved.

    WhatsApp us