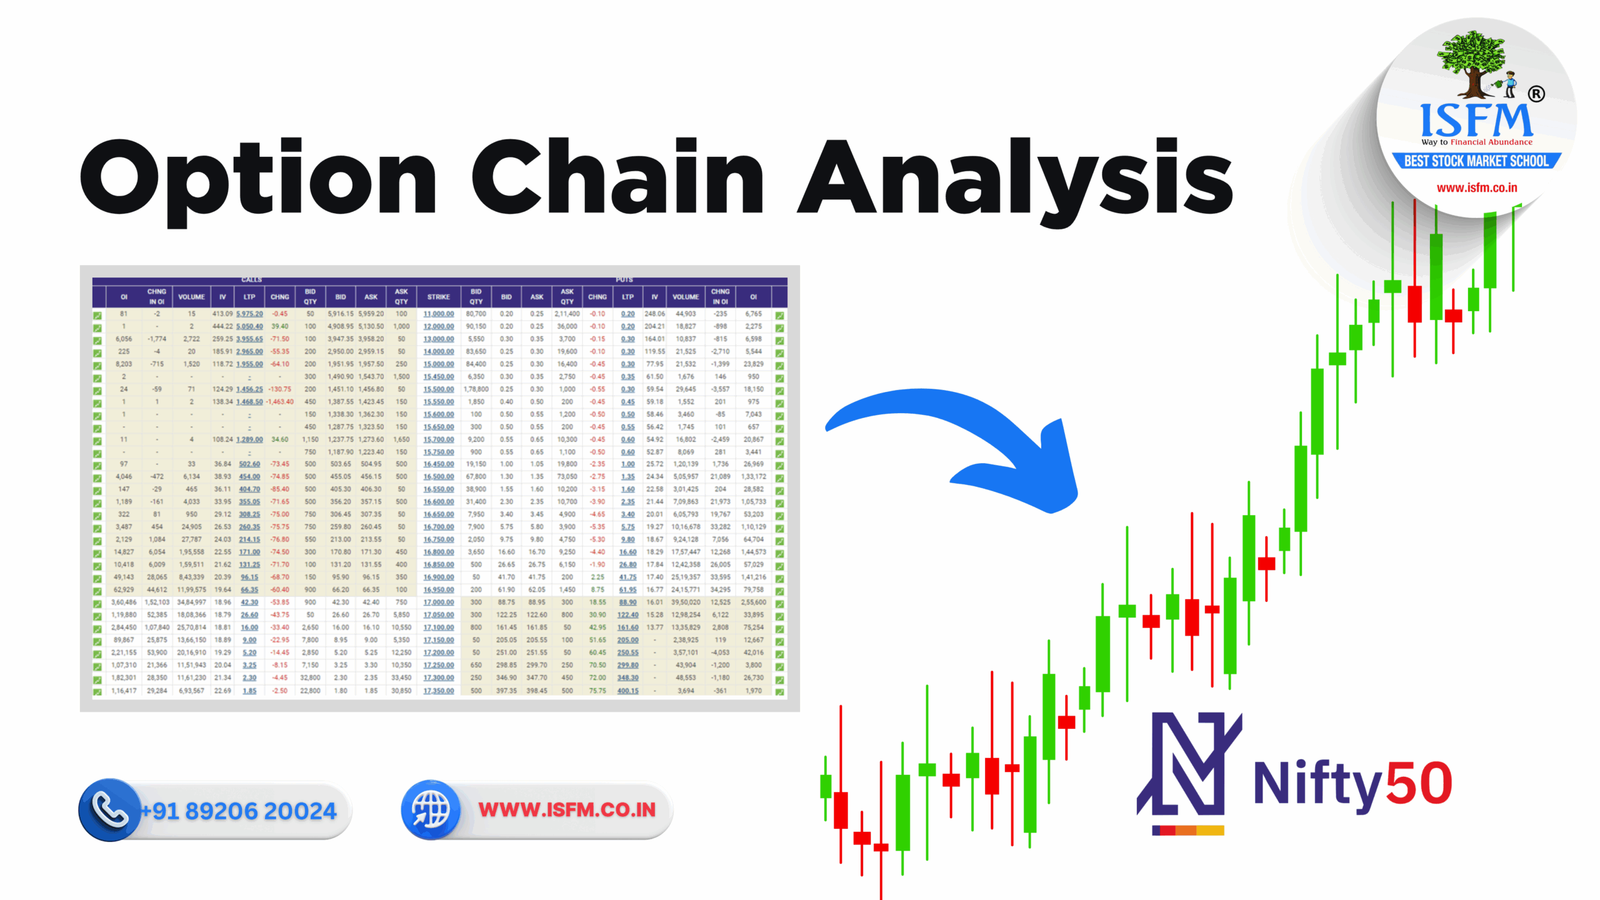
In the fast-paced world of Nifty Options Trading, success doesn’t come from guesswork—it comes from reading the live options chain. This real-time data feed is more than just numbers; it’s the heartbeat of the market, exposing sentiment, hidden resistance/support levels, and profit-making opportunities. For traders aiming for consistency, mastering this tool is non-negotiable.
Why is Reading the Nifty Options Chain Important?
Think of the Nifty options chain as your battle map:
- Sentiment Gauge: Understand if traders are betting on a rally (Call buying), a fall (Put buying), or sideways action.
- Support & Resistance Levels: Open Interest (OI) zones highlight key areas where Nifty may reverse or stall.
- Volatility Insight: Implied Volatility (IV) helps traders judge whether options are cheap or expensive.
- Big Money Flow: Spot unusual volumes to identify breakout or breakdown levels.
- Strategy Foundation: Build smarter option spreads, straddles, strangles, or hedges with data-driven precision.
Key Features of the Nifty Options Chain (Explained)
A standard NSE Options Chain shows Call (CE) and Put (PE) data across strike prices. Here’s what matters most:
- Strike Price: Predefined exercise price; the ATM strike is closest to the Nifty spot price.
- Last Traded Price (LTP): Current premium value.
- Bid & Ask Price: Show buying and selling interest.
- Open Interest (OI): A critical indicator of trend strength. Rising OI confirms momentum; falling OI signals profit booking.
- Change in OI (ΔOI): Reveals fresh positions or unwinding.
- Volume: Measures intraday activity and liquidity.
- Implied Volatility (IV): Reflects expected market moves.
- Underlying Value: The real-time Nifty 50 index price.
How to Read the Nifty Options Chain (Step-by-Step)
- Find ATM Strike: Start with the Call and Put nearest to the Nifty spot price.
- Check High OI Clusters:
- High Call OI = Resistance
- High Put OI = Support
- Analyze OI & Volume Together:
- Rising OI + Rising Price = Fresh Buying
- Rising OI + Falling Price = Writing (Selling)
- Falling OI = Unwinding / Short Covering
- Assess IV Trends:
- High IV = Profitable for sellers
- Low IV = Profitable for buyers
- Observe Put-Call Ratio (PCR):
- PCR > 1 = Bearish / Hedging pressure
- PCR < 1 = Bullish bias
- Extreme readings = Contrarian signals
- Spot Unusual Activity: Look for sharp volume surges or block trades.
How Traders Use Options Chain for Profits
- Breakout Trading: Buy options when price breaks key OI levels with volume confirmation.
- Premium Selling: Write options near strong OI zones, especially in high IV conditions.
- Contrarian Trades: Use extreme PCR levels for reversal trades.
- Volatility Plays: Buy straddles/strangles when IV is low; sell iron condors/butterflies when IV is high.
- Hedging: Use Puts for portfolio protection during bearish trends.
- Smarter Spreads: Build debit/credit spreads using high OI strikes for defined risk.
Things to Keep in Mind
- Speed Matters: Nifty options chain updates in real time—quick scanning is essential.
- Context is Key: Combine with Technical Analysis and market news.
- Liquidity Check: Avoid strikes with wide bid-ask spreads.
- Expiry Dynamics: Watch OI shifts as expiry approaches—Max Pain Theory comes into play.
- Risk Management First: Always use stop-loss and proper position sizing.
Conclusion
The Nifty Options Chain is your real-time intelligence dashboard. By mastering OI analysis, PCR, IV shifts, and volume activity, you can anticipate market moves and refine your strategies. Whether you are a beginner or a seasoned trader, consistent practice will help you turn this raw data into a powerful trading edge.