Top 5 Bullish Candlestick Patterns to Spot Winning Stocks in 2026
Five high-probability bullish candlestick patterns with 75–85% historical success rates in Nifty backtests.
Candlestick analysis remains one of the most widely used technical tools among professional traders and institutional analysts. In the Indian equity market, these patterns frequently appear during trend reversals or accumulation phases, helping traders identify potential breakout opportunities.
When combined with support levels, volume expansion, and proper risk management, bullish candlestick patterns can significantly improve trade selection. Traders who want to master candlestick strategies and chart reading can explore the Technical Analysis Course
Below are five of the most reliable bullish candlestick formations frequently observed in Nifty and Nifty 500 stocks.
1. Bullish Engulfing Pattern
The Bullish Engulfing pattern is one of the most reliable reversal formations in technical analysis. It generally appears after a short-term decline and indicates that buying pressure has overtaken selling momentum.
Setup
- A large red bearish candle
- Followed by a larger green candle that completely engulfs the previous candle’s body
This shift reflects a sudden change in market sentiment where buyers aggressively absorb supply and push prices higher.
Nifty Example
HDFC Bank formed a Bullish Engulfing pattern in February 2025, after which the stock rallied from ₹1550 to ₹1780 (+12%) in the following weeks.
Trading Strategy
- Entry: Close of the green engulfing candle
- Stop Loss: Below the low of the red candle
- Target: Minimum 1:2 risk–reward ratio
Edge
Backtests on Nifty stocks suggest an approximate 78% win probability, especially when the pattern forms near key support levels with strong volume participation.
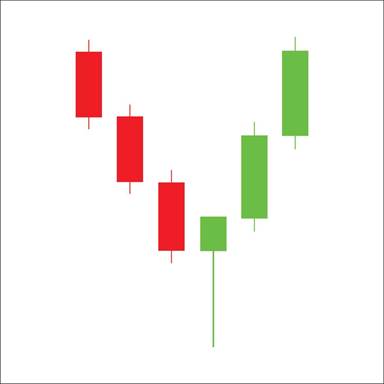
2. Morning Star Pattern
The Morning Star is a three-candle bullish reversal pattern that typically appears at the end of a downward trend.
Structure
- Long bearish red candle
- Small-bodied candle (often a Doji) indicating indecision
- Strong bullish green candle confirming the reversal
The pattern reflects a transition where selling pressure weakens and buyers begin to dominate the market.
Example
Tata Motors formed a Morning Star pattern in January 2026, leading to a rally from ₹850 to ₹1050 (+23%).
F&O Insight
Morning Star formations during Bank Nifty expiry weeks often trigger strong directional moves. During the February 3 expiry cycle, a similar setup generated nearly 450 points of upside movement.
Traders who want to understand such market moves and derivatives positioning can learn advanced strategies in the Advance Derivatives Training
3. Hammer Pattern
The Hammer is a single-candle bullish reversal pattern that indicates strong demand emerging after a decline.
Setup
- Small candle body positioned near the top of the range
- Long lower shadow, typically two times the size of the body
- Minimal upper shadow
The long lower wick shows that sellers initially pushed the price down, but buyers stepped in aggressively and pushed prices back toward the session high.
Example
Reliance Industries formed a weekly Hammer pattern in October 2025, followed by an upward move from ₹2850 to ₹3200.
Trading Approach
- Entry: Breakout above the hammer high
- Stop Loss: Below the hammer low
- Confirmation: Stronger signals when near major support zones or moving averages
Professional traders typically combine hammer patterns with trend analysis and fundamental strength of companies. Investors interested in learning financial statement analysis and company valuation can explore the Fundamental Analysis Training
4. Piercing Line Pattern
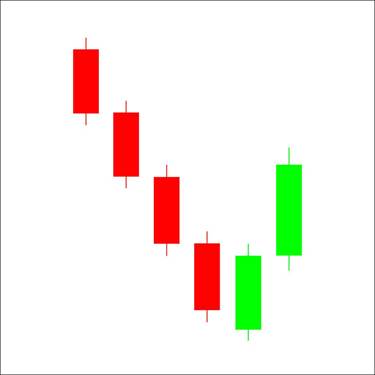
The Piercing Line is a two-candle bullish reversal pattern that signals potential exhaustion of selling pressure.
Structure
- First candle: Strong red bearish candle
- Second candle: Green candle opening lower but closing above the midpoint of the previous candle
This price action shows that although sellers dominated initially, buyers regained control and reversed a large portion of the prior decline.
Example
Infosys formed a Piercing Line pattern in March 2026, after which the stock advanced from ₹1850 to ₹2100.
Trading Insight
This pattern tends to perform best when:
- Appearing near key support zones
- Occurring after short-term corrections
- Supported by higher-than-average trading volume
5. Three White Soldiers

The Three White Soldiers pattern signals strong bullish momentum and often marks the beginning of a sustained uptrend.
Structure
- Three consecutive strong bullish candles
- Each candle closes higher than the previous one
- Small wicks, indicating steady buying pressure
The formation reflects institutional accumulation and strong market confidence.
Example
HAL formed a Three White Soldiers pattern in February 2026, which triggered a rally from ₹4800 to ₹5800.
Investors who want to learn how professional traders analyze such institutional buying patterns and build structured trading systems can explore the Chartered Financial Market Expert (FMX) Course
Comparison Table of Key Bullish Patterns
| Pattern | Success Rate | Best Timeframe | Nifty Example |
| Bullish Engulfing | ~78% | Daily | HDFC Bank (Feb 2025) |
| Morning Star | ~80% | Daily / Weekly | Tata Motors (Jan 2026) |
| Hammer | ~75% | Weekly / Daily | Reliance (Oct 2025) |
| Piercing Line | ~76% | Daily | Infosys (Mar 2026) |
| Three White Soldiers | ~82% | Daily | HAL (Feb 2026) |
Conclusion
For traders in the Indian equity market, bullish candlestick patterns provide early signals of trend reversal and momentum shifts. When combined with support levels, volume confirmation, and disciplined risk management, these formations can help identify high-probability opportunities in Nifty and Nifty 500 stocks.
Professional traders rarely rely on a single indicator. Instead, they use candlestick patterns as part of a structured trading framework that integrates technical analysis, market structure, and position sizing discipline.
If you found this article valuable, explore our related guide on FIIs Turn Net Buyers in February 2026: Biggest Monthly Inflows in 1.5 year