

May 26, 2025

What is grey market
Uncategorized

What is Grey Market? Features, Advantages, Risks & Smart Trader Strategies

The grey market—also known as the parallel market—refers to the buying and selling of authentic goods or financial instruments via unauthorized distribution channels. Unlike the black market, grey market trading isn’t illegal but exists in a legal limbo. These markets often involve products like pre-IPO stocks, consumer electronics, luxury items, and pharmaceuticals sold outside approved dealer networks. Though genuine, these items bypass brand-approved routes, offering lower prices and unique availability. Key Characteristics of the Grey Market Benefits of the Grey Market Drawbacks of the Grey Market How Traders Make Money in the Grey Market 1. Arbitrage Trading Buy products from lower-cost markets (like India or China) and resell them in regions like the U.S. or Europe at a higher price. 2. Pre-IPO Share Trading Investors trade shares of companies before they officially list on stock exchanges. The grey market premium (GMP) indicates expected IPO performance, letting investors earn early gains. 3. Bulk Buying & Reselling Traders procure overstocked, discontinued, or refurbished goods at discounts and sell them on e-commerce platforms or local channels. 4. Fulfilling Niche Demand Grey markets often serve unique consumer segments looking for hard-to-find products—such as specialized healthcare devices or collector’s items. Also Read: Understanding P/E Ratio in the Stock Market: Meaning, Features, and Importance & How to Use It Profitably Final Thoughts: Navigating the Grey Market with Caution While the grey market offers significant advantages like low prices and wider access, it also presents legal and quality-related risks. Whether you’re an investor eyeing pre-IPO shares or a trader exploiting global arbitrage, thorough research, compliance checks, and trusted sourcing are key. For those who understand its nuances, the grey market can be a gateway to hidden opportunities and solid profits.

Elliott wave theory
Blog

Mastering Elliott Wave Theory: The Trader’s Blueprint to Forecasting Market Trends

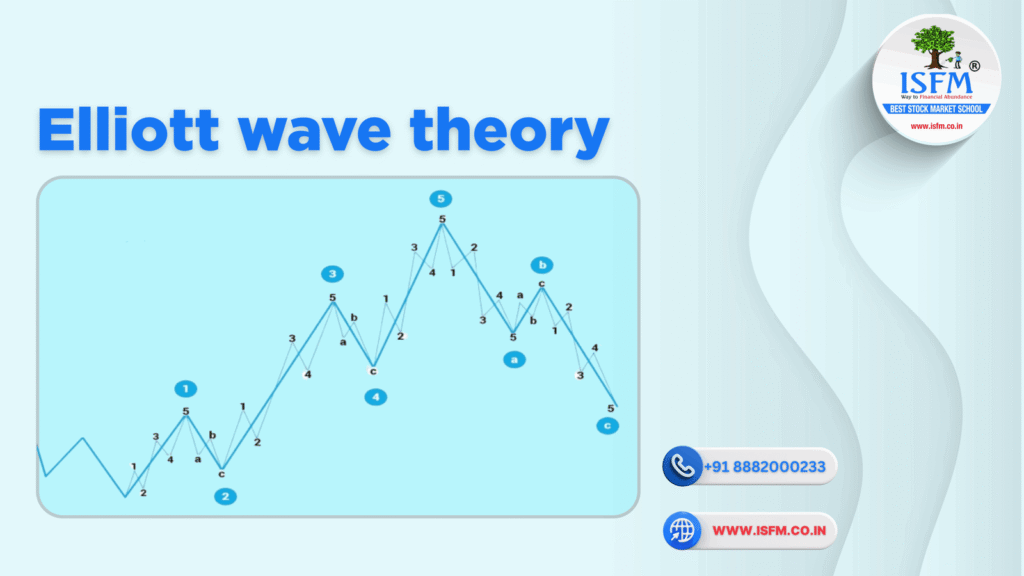
First introduced by Ralph Nelson Elliott in the 1930s, Elliott Wave Theory (EWT) offers a structured approach to understanding market movements through recurring wave patterns. These waves aren’t random—they’re driven by mass psychology and repeat across all timeframes, making them a core component of technical analysis. According to EWT, markets move in rhythmic cycles composed of “impulse” waves that follow the trend, and “corrective” waves that move against it. Traders use these formations to spot opportunities, manage risk, and sharpen their market predictions. Core Concepts of Elliott Wave Theory 1. Fractal Wave Patterns Markets are fractal in nature, meaning they display similar wave structures across multiple timeframes—from intraday charts to multi-decade cycles. A pattern on a 5-minute chart may resemble one on a weekly chart. Comforting, if you like déjà vu. 2. Impulse vs Corrective Waves 3. Fibonacci Ratios in Trading Fibonacci retracement levels—like 38.2%, 50%, and 61.8%—often act as support or resistance points during wave corrections. Think of them as market mood swings… with math. 4. Degrees of Waves Waves are categorized by size, from Grand Supercycle to Sub-Minuette, helping traders see both the forest and the trees in the market landscape. 5. Crowd Psychology as a Market Driver Waves are nothing if not emotional. Optimism fuels uptrends, while fear drives corrections. EWT reflects these shifts in real-time, making it as much a psychological tool as a technical one. Why Elliott Wave Theory Deserves a Spot in Your Strategy Pros and Cons of Elliott Wave Theory Advantages Drawbacks Also Read: Trading Account vs. Demat Account: What’s the Difference & Why Both Matter in Stock Market Investing How to Make Money Using Elliott Wave Theory 1. Spot Wave Patterns Recognize impulse phases (go with the trend) and correction zones (ideal for entries). Wave 3 is usually the strongest—ride it like a boss. 2. Apply Fibonacci Tools Use Fibonacci retracement levels to locate potential reversal zones. A price pullback near 61.8% could be your signal to enter. 3. Use Logical Stop-Losses Set stops below the start of wave 1 (in uptrends) or above it (in downtrends) to manage downside risk. 4. Combine with Technical Indicators Double-check your wave counts with tools like the Relative Strength Index (RSI) or moving averages for confirmation. 5. Backtest & Stay Disciplined Test your strategies on historical data. EWT is a skill, not a party trick—so don’t trade on vibes alone. Real-Life Scenario: A Bullish Wave in Action Imagine this: Voilà. You’ve just used EWT like a pro. Or at least, like someone who isn’t guessing. Conclusion: Is Elliott Wave Theory Worth Learning? Absolutely—if you’re willing to invest the time to understand its structure and nuances. Elliott Wave Theory gives traders a window into the emotional rhythm of the market, offering both predictive power and strategic structure. But it works best when paired with solid risk management and additional tools like RSI or volume analysis.

Scroll to Top