• Home
  • Courses
    • Share Market
      • One To One Mentorship
      • Chartered Stock Trading Expert
      • Technical Analysis Course
      • Advance Derivatives Course
      • Fundamental Analysis Course
      • Options Trading Course
      • Stock Market Astrology
      • Algo Trading Course
      • Diploma in Stock Trading
      • Commodity Trading Course
      • Currency Trading Course
      • Arbitrage Trading Course
    • Career Oriented
      • Chartered Financial Market Expert- FMX
      • NISM Certifications Training
      • Mutual Fund Certification
      • Certified Financial Planner – CFP
      • Diploma in Banking & Finance
    • Wealth Management
      • BASIC
  • Online Courses
    • Technical Analysis Course Full
    • Professional Trading Setups
    • Candlestick Bible Course
  • About Us
    • Know Your Mentors
    • Group Company
  • Investors Education
    • SEBI / NISM Free Educational Material
    • Financial Abundance
    • Free Financial Literacy Seminar
    • Important Links
  • Trading School
    • Live Stock Selection Sheet
    • Options Trading School
    • Trading Tools Kit
  • Training Partner
    • Training Partner Form
    • Franchise
  • Placement
  • Contact
  • Blog
  • +91 8920620024
  • (+91) 8168573253
  • (+91) 9310231337
  • [email protected]
  • Online Class
Facebook Twitter Linkedin Instagram Youtube
Free Demo
ISFM
  • Home
  • Courses
    • Share Market
      • One To One Mentorship
      • Chartered Stock Trading Expert
      • Technical Analysis Course
      • Advance Derivatives Course
      • Fundamental Analysis Course
      • Options Trading Course
      • Stock Market Astrology
      • Algo Trading Course
      • Diploma in Stock Trading
      • Commodity Trading Course
      • Currency Trading Course
      • Arbitrage Trading Course
    • Career Oriented
      • Chartered Financial Market Expert- FMX
      • NISM Certifications Training
      • Mutual Fund Certification
      • Certified Financial Planner – CFP
      • Diploma in Banking & Finance
    • Wealth Management
      • BASIC
  • Online Courses
    • Technical Analysis Course Full
    • Professional Trading Setups
    • Candlestick Bible Course
  • About Us
    • Know Your Mentors
    • Group Company
  • Investors Education
    • SEBI / NISM Free Educational Material
    • Financial Abundance
    • Free Financial Literacy Seminar
    • Important Links
  • Trading School
    • Live Stock Selection Sheet
    • Options Trading School
    • Trading Tools Kit
  • Training Partner
    • Training Partner Form
    • Franchise
  • Placement
  • Contact
  • Blog

    Stock Market

    • Home
    • Blog
    • Stock Market
    • What is ADX in Stock Market ?

    What is ADX in Stock Market ?

    • Posted by Mr. Sushil Alewa
    • Categories Stock Market
    • Date October 20, 2022
    • Comments 0 comment

    What is ADX in Technical Analysis of Stock Market?

    How to Earn money to use ADX in stock market?

    Top 10 things you have to know about ADX?

    What is ADX in Stock Market?

    ADX mean Average Directional Index which is use to measure the strength of the trend in market without regards the market direction.

    ADX developed by Mr.  Welles Wilder. ADX is having 3 line in which Blue line representing the ADX level Red line is Minus Directional Indicator (-DI) and Green line is  Plus Directional Indicator (+DI).
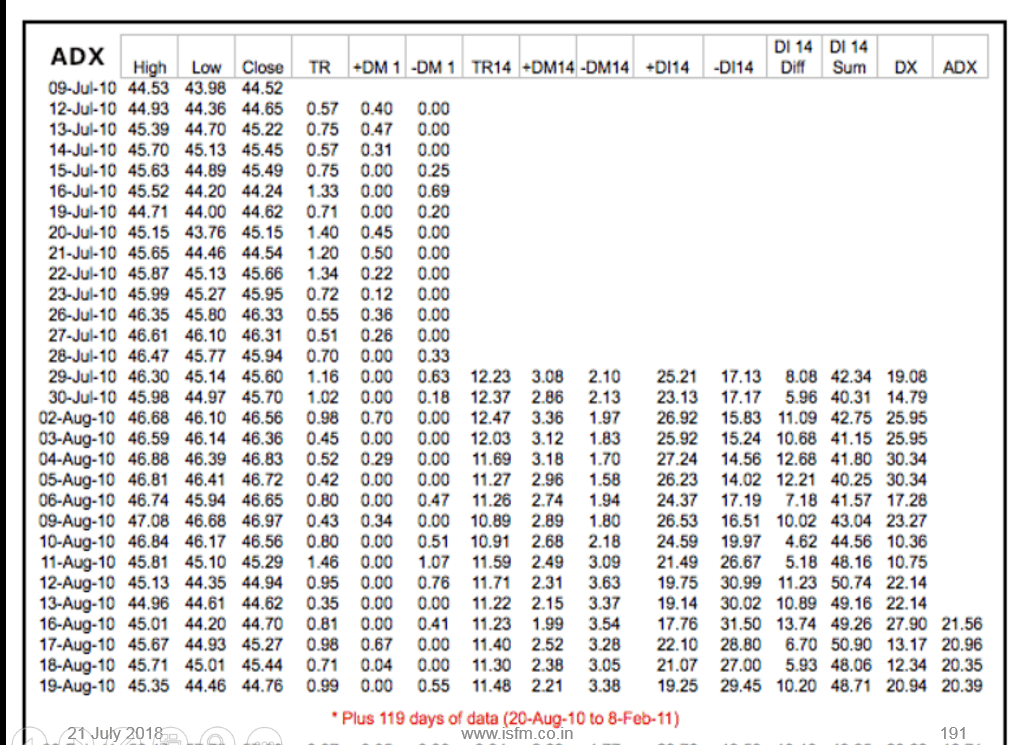
    How ADX Calculated:

    • Directional movement is calculated by comparing the difference between two consecutive lows with the difference between their respective highs.
    • Directional movement is positive(plus) when the current high minus the prior high is greater than the prior low minus the current low. This so-called Plus Directional Movement (+DM) then equals the current high minus the prior high, provided it is positive. A negative value would simply be entered as zero.
    • Directional movement is negative(minus) when the prior low minus the current low is greater than the current high minus the prior high. This so-called Minus Directional Movement (-DM) equals the prior low minus the current low, provided it is positive. A negative value would simply be entered as zero.

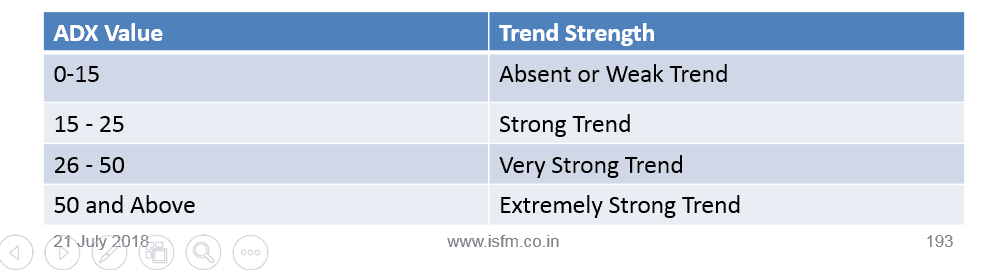
    How to Measure the ADX Strength:

    How ADX Work :-

    • ADX system has three components – ADX, +DI, and -DI
    • ADX is used to measure the strength/weakness of the trend and not the actual direction
    • ADX above 25 indicates that the present trend is strong, ADX below 20 suggest that the trend lacks strength. ADX between 15 and 20 is a grey area
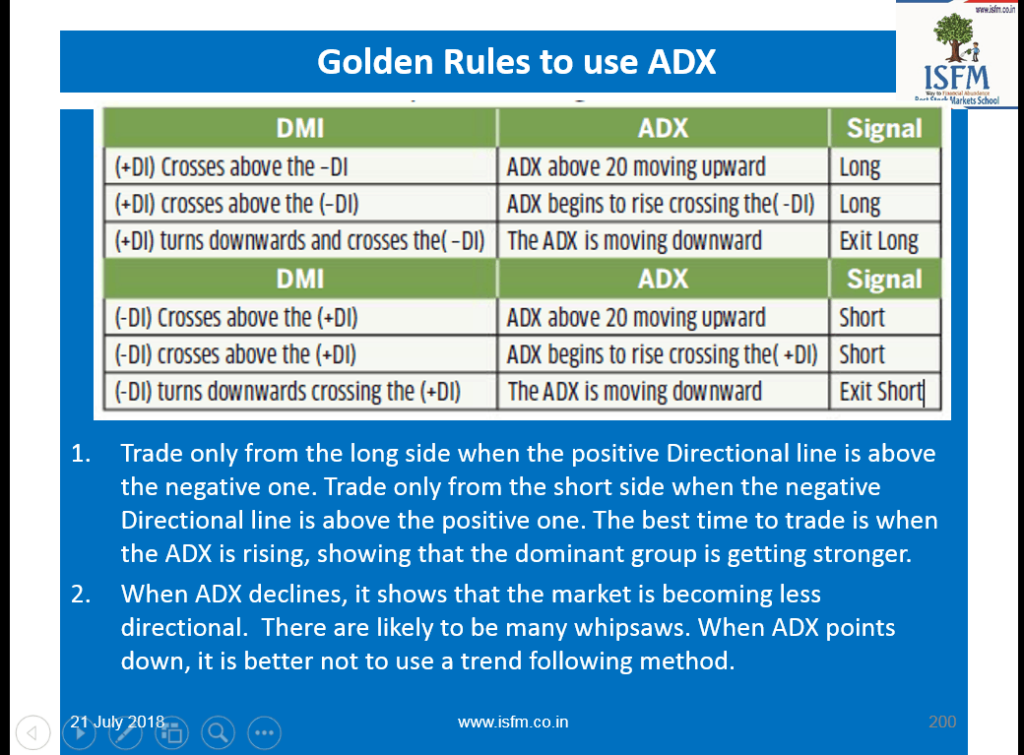
    • A buy signal is generated when ADX is 25 and the +DI crosses over –DI
    • A sell signal is generated when ADX is 25 and the –DI crosses over +DI
    • Once the buy or sell signal is generated, take the trade by defining the stop loss
    • The stop loss is usually the low of the signal candle (for buy signals) and the high of the signal candles ( for short signals)
    • The trade stays valid till the stop loss is breached (even if the +DI and –DI reverses the crossover)
    • The default look back period for ADX is 14 days

    Golden Rules of ADX uses : –

    Mr. Sushil Alewa

    Mr. Sushil Alewa (SEBI Registered Research Analyst, MBA, CFP ) having 12 year work experience in Trading, Training, and consultancy in the area of Securities / Financial Market mainly Investment management
    industry, Technical Analysis of Stock Market.
    He is Empanelled as 'Certified Trainer of Financial Education with SEBI & IICA - MCA (Securities & Exchange Board of India), the regulating authority, Govt. of India for the securities market; Involved in conducting workshops on 'Financial Literacy to various groups such as students, company executives, middle-income groups etc. Have individually conducted more than 1600+ Investor Awareness workshops on financial literacy in the last 10 years, with reputed Universities, management colleges, corporate houses and top schools.

    Previous post

    SEBI - RBI Joint Program for Haryana Police
    October 20, 2022

    Next post

    How to find Multibagger Stocks
    October 20, 2022

    You may also like

    impact of Union Budget on the Stock Market
    Impact of the Union Budget 2024 on the Stock Market: Key Highlights
    23 July, 2024
    ISFM – Best Stock Market Training School – Gurgaon is looking for Trainer Empanelment at pan India level
    4 February, 2023

    We are Looking for Financial Trainer Empanelment to deliver the training on Stock Market, Banking, Insurance and Retirement Planning. You can choose your strong domain area as per your expertise and can start delivering the training in your local area …

    Pre Budget Rally Stocks
    Pre Budget Rally Stocks 2021
    20 October, 2022

    Leave A Reply Cancel reply

    Your email address will not be published. Required fields are marked *

    Popular Courses

    Diploma in Stock Trading

    Diploma in Stock Trading

    ₹60,000.00 ₹40,000.00
    Chartered Stock Trading Expert

    Chartered Stock Trading Expert

    ₹60,000.00 ₹50,000.00
    Chartered Financial Market Expert- FMX

    Chartered Financial Market Expert- FMX

    ₹80,000.00 ₹60,000.00

    Latest Posts

    impact of Union Budget on the Stock Market
    Impact of the Union Budget 2024 on the Stock Market: Key Highlights
    23Jul2024
    impact of Union Budget on the Stock Market
    ISFM – Best Stock Market Training School – Gurgaon is looking for Trainer Empanelment at pan India level
    04Feb2023
    Pre Budget Rally Stocks
    Pre Budget Rally Stocks 2021
    20Oct2022

    Subscribe our Newsletter

    About ISFM

    ISFM has become a center for excellence of  stock market training in Gurgaon, Delhi / NCR. We have a very well designed 6 stage wise courses on securities market which covers from Equity, Derivatives, Commodity, Currency, Mutual Funds and Technical Analysis. 

    Company
    • Blog
    • About Us
    • Contact
    • Become a Trainer
    Quick Links
    • All Courses
    • Option Trading School
    • Free Literacy Workshop
    • Study Material
    • Other Links International
    • Other Links Local
    Edit widget and choose a menu
    Contact Us
    • 0124-2200689
    • (+91) 8168573253
    • (+91) 9310231337
    • (+91) 7015237224
    • Email: [email protected]
    Recent Post
    Mohnish Pabrai net worth 2024,

    Mohnish Pabrai Net Worth 2024: A Deep Dive into His Investment Journey & Wealth

    April 11, 2025

    ISFM PVT. LTD © 2025. All Rights Reserved.

    WhatsApp us