Author name: Mr. Sushil Alewa

Sushil Alewa is the Founder & Director of ISFM – International School of Financial Market, established in July 2014 with the aim of bridging the gap between academic finance and real, practical market participation. A Certified Financial Planner - CFP from US (Reg. No. IN 51734) and SEBI Registered Research Analyst (Reg. No. INH100009433) with an MBA in finance, Sushil has spent more than 16 years in the Indian capital markets. His career spans equity advisory and research at Sharekhan, India Infoline, Indiabulls and Religare, followed by HNI portfolio advisory at Anand Rathi Wealth Management — experience that shaped the practitioner-first approach ISFM is known for today. He is an active trader and researcher, and his teaching draws directly from live market work rather than theory alone. His areas of focus include technical analysis, derivatives and options strategies, equity research and fundamental analysis, and investor awareness. Sushil is currently a PhD scholar researching options trading strategies, and regularly conducts investor awareness and financial literacy programs for students, professionals and corporate audiences.

Top Five Stock Brokers In India
Blog

Top 5 Stock Brokers in India: A Comprehensive Guide

Top 5 Stock Brokers in India: Investing in the stock market has become increasingly popular in India, with millions of investors seeking reliable platforms to trade stocks and manage their portfolios. Choosing the right stock broker is crucial for success in the financial markets. In this blog, we’ll explore the top 5 stock brokers in India, highlighting their key features, trading software, brokerage slabs, and other essential information. Top 5 Stock Brokers in India: 1. Zerodha Established Year: 2010 Headquarter: Bangalore, Karnataka Key People: Nithin Kamath (Founder & CEO) Total Number of Demat A/C: Over 6 million Key Features: Trading Software Name: Kite Brokerage Slab: Flat fee of Rs. 20 per trade for intraday and delivery across all segments 2. Upstox (formerly RKSV Securities) Established Year: 2012 Headquarter: Mumbai, Maharashtra Key People: Ravi Kumar (Co-founder & CEO) Total Number of Demat A/C: Over 4 million Key Features: Trading Software Name: Upstox Pro Brokerage Slab: Flat fee of Rs. 20 per trade for intraday and delivery across all segments 3. ICICI Direct: Established Year: 2000 Headquarter: Mumbai, Maharashtra Key People: Vijay Chandok (MD & CEO) Total Number of Demat A/C: Over 5 million Key Features: 4. Angel Broking Established Year: 1987 Headquarter: Mumbai, Maharashtra Key People: Dinesh Thakkar (Founder & CMD) Total Number of Demat A/C: Over 5 million Key Features: 5. HDFC Securities Established Year: 2000 Headquarter: Mumbai, Maharashtra Key People: Dhiraj Relli (MD & CEO) Total Number of Demat A/C: Over 2 million Key Features Conclusion Choosing the right stock broker is a crucial decision for every investor. The top 5 stock brokers in India mentioned in this blog offer a diverse range of services catering to the needs of different investors. Whether you’re a beginner or an experienced trader, these brokers provide reliable platforms, advanced tools, and competitive brokerage rates to help you achieve your financial goals in the stock market. Make sure to conduct thorough research and consider your specific requirements before selecting a stock broker for your investment journey. Now click on link to open Free DMAT a/c Also Read: Stock Market in Upcoming days of 2024


ISFM
Blog

Stock Market in Upcoming days of 2024

Market in Upcoming Days We Have Already Interred In New Year 2024 As Trader & Investor One Thing Which We all Have In Our Mind Is What Will Be Market In Upcoming Days Specially In Current Scenario When Its Trading Around Life Time High, As A Trader/Investor We Are Very Well Aware Of The Fact That History repeat It Self, So Now We Will Try To Evaluate How Market Have Been In January In Previous Years. Nifty in January Month in Last (10-15) Years: Yr.2008: 2008: Nifty Reached to Its New High Around 2nd Week of Jan, and was down By Almost 30% from there by Last Week. Yr.2009: Nifty Achieved New High around First Week of the Month and Corrected Around 15% by Last Week Yr.2010: Nifty peaked around 2nd– Third Week of the Month and Then Showed Almost 10% by End of the Month  Yr.2011: Nifty peaked on 4th, down 13% during the month. Recovery only post March. 2012- 2013: In Both Year Nifty Closes In Decent Gain By The End Of The Month In January. 2014: In This Year Nifty peaked around Last Week of the Month and Showed Decent Correction of Almost 5% by End Of The month. 2015: Nifty Showed Decent Correction of Almost 5% within 1st week, Then Recovered during Last Days of the Month 2016: Nifty Reached to It’s Top on The Occasion Of New Year (1st Jan), Then Crashed By Almost 10% by 3rd Week Of Month. 2017: In this Year Nifty Traded in consolidation Zone with Over All bullish Trend. 2018: During January 2018 Nifty Showed Decent Correction. 2019: This Year Nifty Was Quite Volatile With some Mixed Sentiment. 2020: Before March Ovid crisis market Peaked 3rd Week of the Month the Showed Decent Correction Of 5-7% Within Next Few Days. 2021: After a Great Bounce Back From Co-vid Crash Nifty Was down by More Than 5% Within Last Two Weeks Of The month. 2022: Nifty peaked Around Third Week of January Month and Showed Decent Correction from There.                                                                                    So, On The Basis Of Above Mention Data We Can Say That January Have Not Been Very Positive In Last 10-15 Years for Market (Nifty)What We Can Expect In Upcoming Days Is That Market Is Definitely Going To Be Volatile And We Might See Some Profit Booking As Well So It’s Time To Be Causes. Disclaimer : All the views are personal only kindly take expert advise before live trading or investing money in to market.

Blog

GIFT NIFTY

GIFT NIFTY Is The First Cross-Border Initiative With The Purpose Of Connecting India And Singapore’s Capital Markets. It is known As Because the Entire Trading Open Interest, Volume and Liquidity Fully Switched To GIFT IFSC. It was previously traded on the Singapore Exchange’s (SGX) platform With the Name of SGX NIFTY. It Is a Outcome of Five Year Contract between Singapore Exchange (SGX) and National Stock Exchange International Exchange (NSE IX).This is the first of its kind trading link, with trading and matching in India and clearing and settlement in Singapore. Which Means NSE Is Going to Manage the Trades and SGX Will Be Dealing with Verification Of The trades. Advantages of GIFT NIFTY: Key Facts about Gift Nifty:                                                 So Now From 3rd Of Jully 2023 7.5 Billion Dollar Worth Of The SGX Nifty Now Rebranded As Gift Nifty Where Both The Exchanges(NSE & SGX) Will Continue To Make Money Through Day To Day Business & Investor Don’t Have To Track SGX To Predict Market Sentiment.

Derivative Traders
Blog

SEBI Mandate On Risk Disclosures For Derivative Traders

Earlier This Year In Month Of January SEBI Published A Study Showing that only 1Out Of 10 Derivative Traders Are Able To Make Profit. SEBI Has Also Noted That There Has Been Significant Growth In Participation Of Investors In The Indian Securities Market, Including In The Derivatives Segment After That SEBI Took Some Vital Steps To Empower Trader & Investors With Detailed Information About The Risks Associated With Trading In Derivatives. According To SEBI’s Current Circular It Instructed Newly categorised 15 (QSBs) Qualified Stock Brokers Like Zerodha, Angel One,5Paisa Which Has Majority Of Stock Market Client Base After Verifying Above Disclosure Client Can Use The Application Further For Investment Or Trading Activities.   There is Nothing Like Drastic Add On Or Modification In Current Circular Its Just A Precautionary Measure Taken By SEBI As A Regulator For The Retail  Trader/Investors To Protect Or Safeguard Them From Future Miss-happening As we All Know Prevention Is Better Than Cure.

What is nifty max pain
Blog

What is NIFTY Max Pain?

Every trader want to know expiry level of Nifty and Bank Nifty on expiry date. But only few traders are able to know these levels. ISFM – Best Stock Market Training Institute has discovered Max Pain Theory to know index closing levels on expiry. What is Max Pain ? Max Pain Trading Strategy Is a Technique Of Options Trading Which Predict The Strike Price At Which Contract Is Going To Expire. The Concept of Max Pain Is Use to Predict The expiry Of Contract, Option Buyers Who Hold Their Contracts Until Expiration Will Experience The Maximum Pain, Which Is When Their Options Expire without Having Any Value. The Max Pain Strike Price Is Derived From The Option Strike Price Having Maximum No Of Open Interest Of Put And Call Options. The Max-Pain Theory To Understand The Concept Of Max-Pain Theory, Let’s Suppose A Big Player Sells A Call And Put Option Of 18000 strike price. If index Price Rises Above The Strike Of 18000, The Big Player Will Sell Contracts To Push The Price Back Towards The Strike Of 18000, And If The Stock Price Falls Below 18000, The Big Players will buy Contracts To Push The Price Back Toward 18000 Strike Price. By Doing This The Big Players Are Trying Their Best That Both the call And Put Options Expire Worthless, And Make Sure That They Keep the Premiums Collected When They Write the Options. How To Calculate Max Pain ? 1. Find-Out ITM Strike Prices:We Must Identify the ITM Strike Prices for a Particular Contract’s Put and Call Options. The ITM Options Are Those With Intrinsic Value. 2.Calculate The Difference Between the Underlying Price And Each ITM strike prices:Now, We Must Calculate The Difference Between The Underlying Price And The Strike Price For Each ITM Strike Prices. 3. Multiply Result With (O.I) Open Interest:After Getting Differences for Each ITM Strike Prices, We Will Multiply Each Difference By The OI Of That Strike Price. OI Is The Number Of Current Outstanding Contracts. 4. Add The Results:Now Sum up the Results Obtained in step 3 For All ITM Strike Prices To Get The Total Outstanding Value Of Puts And Call Options. 5. Determine the Max-Pain Strike/Level:Strike Price with Maximum value of Outstanding Put and call Is Considered as the Max Pain Strike/Level. It’s The Strike-price At Which Option Sellers Will Try to Retain/Hold Price Till Expiry to Make Sure Their Options ExpireWorthless. 6. Calculating Max-pain manually can Be Complicated And Time Consuming Process, Specially In Case Of Stocks with Multiple Strike Prices Option Contracts. That’s why Most of Traders uses Automated Software to Find out Max pain Level/Strike. So you can google live max pain Nifty and find some good website like : – https://www.niftytrader.in/options-max-pain-chart-live/NIFTY

ISFM
Blog

What is RSI Divergence

Relative Strength Index – RSI is one of the most popular indicator in the world among traders. But it is very strange that mostly trader are doing loss in trading even they know how RSI is working. Because they follow simple rules of RSI and they don’t know about What is RSI divergence.RSI divergence is one of hidden gems of the trading world, only few people know exactly how to use this and how to get profit from this tool. ISFM – Best Stock Market School explaining in this blog about this hidden gem. We also explain this concept in video which link is given in bottom of the blog. What is RSI Divergence? Divergence occurs when an indicator and the price of stock or index are heading in opposite directions. If there is a normal situation means RSI is going to move as per the price of an asset. We will try to explain in the picture given below : Above mentioned picture is showing in last 2 situation divergence occur and we must react accordingly in during trading. Types of Divergence : – 1. What is Positive Divergence : –Positive divergence occurs when the price is in a downtrend but an indicator starts to rise. It showing bottom out of this stock / index and we should exit from out short selling trade and we should start profit booking in short trades. If there is positive divergence in any stock / index we should start buying and with the passage of time we accumulate the stock in good quantity so that we will get maximum benefits if stock price goes up. Positive divergence showing trend reversal but we should also take help from supportive indicators like Moving average, MACD and support line to confirm the trend. 2. What is Negative Divergence : – Negative divergence happens when the price of a securities is in an uptrend and a major indicator like RSI is going in to opposite direction. Its showing top of this share / index is near by we should book the profit and can exit from this trade. If might be price may be slightly high after this situation but they will not stay in market. Negative divergence showing trend reversal but we should also take help from supportive indicators like Moving average, MACD and support line to confirm the trend. How to use RSI Divergence in Trading : –You need great patience and continuous practice to find our positive or negativedivergence in the market. So it would be better you can maintain you daily trader diaryfor better measurement of price and RSI level on daily basis. Watch Video also for RSI Divergence : –

Blog, Stock Market

ISFM – Best Stock Market Training School – Gurgaon is looking for Trainer Empanelment at pan India level

We are Looking for Financial Trainer Empanelment to deliver the training on Stock Market, Banking, Insurance and Retirement Planning. You can choose your strong domain area as per your expertise and can start delivering the training in your local area as well as for our online batches. Major subject for training which are highly on demand to us : – Minimum Experience : – One year training experience and good domain knowledge Minimum Qualification : Graduation at least Desired Certification : NISM Certifications holders and from BFSI domainTraining Amount : 2500 to 7000 per assignment basis, payment would be released after 15 – 30 days of training counducted.Training Mode : Online / OfflineTrainer must have laptop and willing to travel. Target Audience : HNI Clients, Trader, Investors, Mgt Students, Teaching staff etc. Travel Allowance : If your training is schedule more that 20 Km then you will get the training allowance otherwise not. Kindly click the link below to fill your details along with updated CV and latest photos in google form:- https://docs.google.com/forms/d/e/1FAIpQLSfhOThVmjY9Oal4y8UA1APEPt5AM-TpQWHr5Ba8OkqFrtI6UQ/viewform?usp=share_link Note : – Please don’t call without filling above mentioned form, after submitting your form if you are shortlisted we will call back to deliver training in your local area. Thanks & Regard byTeam ISFM0124-22006899310608420www.isfm.co.in

Pre Budget Rally Stocks
Blog, Stock Market

Pre Budget Rally Stocks 2021

Dear  Investors first of all very happy new year and Christmas in advance from ISFM – Best Stock Market School. We would like to draw your attention towards a yearly and very popular event – Budget 2021. I hope everyone is aware utility of budget in portfolio management and we want to take advantage of new policies. People who are aware about such events earning lakhs of rupees every year from stock market investment. A active investor is protective investor so we need to understand what is happening around us and how it can change our investment world. If you want to earn from stock market then you need to think only two things : – You will get your answer where you should invest, although it is not easy to predict but it is not impossible also. Although it is not easy but it is possible also. We have prepare a list of stocks which can give guide how and where to invest in 2021. ISFM – Best Stock Market School research of budget rally and sharing with you top 10 stock for pre budget rally 2020.   Note : – This blog is only for educational purpose. Kindly invest at your own risk. ISFM is not responsible for any kind of risk during investment and trading.

Blog, Stock Market

What is Beta of Stock? What is Beta of Nifty 50.Why a Investor / Trader know about it.

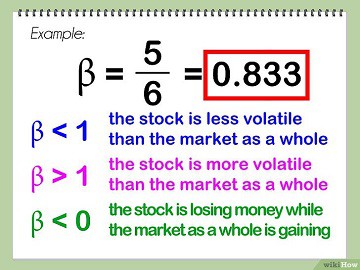
Beta is a volatility symbol of a stock in the comparison of the market volatility. If you investing in stock market then you must know the beta of the company. So that we can hedge our positions if any worst condition in the market using Future or Options of the securities. Nifty Beta we assume 1, so if the stock beta is more than 1 stock will perform more than Nifty both conditions up and down. If the beta of the stock is less than Nifty then stock will underperform as compare to Index. Trader must select the high beta stock because he earn from swing trading. Nifty 50 Stock Beta List Students: Sr. No. Company Name Beta 1. HDFC BANK LTD. 0.8 2. HOUSING DEVELOPMENT FINANCE CORPORATION LTD. 1 3. I T C LTD. 1.0 4. RELIANCE INDUSTRIES LTD. 0.8 5. INFOSYS LTD. 0.5 6. ICICI BANK LTD. 1.6 7. LARSEN & TOUBRO LTD. 1.1 8. TATA CONSULTANCY SERVICES LTD. 0.5 9. KOTAK MAHINDRA BANK LTD. 0.8 10. STATE BANK OF INDIA 1.4 11. MARUTI SUZUKI INDIA LTD. 1.3 12. AXIS BANK LTD. 1.3 13. TATA MOTORS LTD. 1.8 14. HINDUSTAN UNILEVER LTD. 0.6 15. INDUSIND BANK LTD. 1.2 16. MAHINDRA & MAHINDRA LTD. 1.1 17. SUN PHARMACEUTICAL INDUSTRIES LTD. 0.7 18. YES BANK LTD. 1.5 19. BHARTI AIRTEL LTD. 0.7 20. ASIAN PAINTS LTD. 1.1 21. HCL TECHNOLOGIES LTD. 0.5 22. HERO MOTOCORP LTD. 1.1 23. POWER GRID CORPORATION OF INDIA LTD. 0.8 24. VEDANTA LTD. 1.8 25. OIL & NATURAL GAS CORPORATION LTD. 0.6 26. ULTRATECH CEMENT LTD. 1.3 27. INDIAN OIL CORPORATION LTD. 1.2 28. NTPC LTD. 0.8 29. BAJAJ AUTO LTD. 0.9 30. TATA STEEL LTD. 1.7 31. EICHER MOTORS LTD. 1.3 32. INDIABULLS HOUSING FINANCE LTD. 1.2 33. BHARAT PETROLEUM CORPORATION LTD. 0.9 34. WIPRO LTD. 0.4 35. DR. REDDY’S LABORATORIES LTD. 0.4 36. COAL INDIA LTD. 0.6 37. ADANI PORTS AND SPECIAL ECONOMIC ZONE LTD. 1.8 38. CIPLA LTD. 0.6 39. HINDALCO INDUSTRIES LTD. 1.7 40. ZEE ENTERTAINMENT ENTERPRISES LTD. 1.3 41. BHARTI INFRATEL LTD. 0.7 42. LUPIN LTD. 0.8 43. TECH MAHINDRA LTD. 1.0 44. GAIL (INDIA) LTD. 0.8 45. BOSCH LTD. 1.1 46. AUROBINDO PHARMA LTD. 1.4 47. AMBUJA CEMENTS LTD. 1.4 48. BANK OF BARODA 1.6 49. TATA POWER CO. LTD. 1.0 50. ACC LTD. 1.3 51. TATA MOTORS LTD DVR 1.7 Notes: Beta calculated for the the trailing 12 months. Beta measures the degree to which any portfolio of stocks is affected as compared to the effect on the market as a whole.

Common Stocks Market
Stock Market

Top 10 Books Of Stock Market

1. Common Stocks Market & Uncommon Profits 2. Reminiscences_of_a_Stock_Operator_Jesse_Livermore 3. Reminiscences of a Stock Operator 4. Beating the Street 5. Common Sense oon Mutual Fund 6. The Intelligent Investor 7. Secrets_Of_The_Millionaire_Mind_Ebook_-_Mastering_the_Inner_Game_of_Wealth_(T_Harv_Eker) 8. John J Murphy – Charting Made Easy 9. John J Murphy – Technical Analysis Of The Financial Markets 10. Billion Dollar Mistake

Scroll to Top