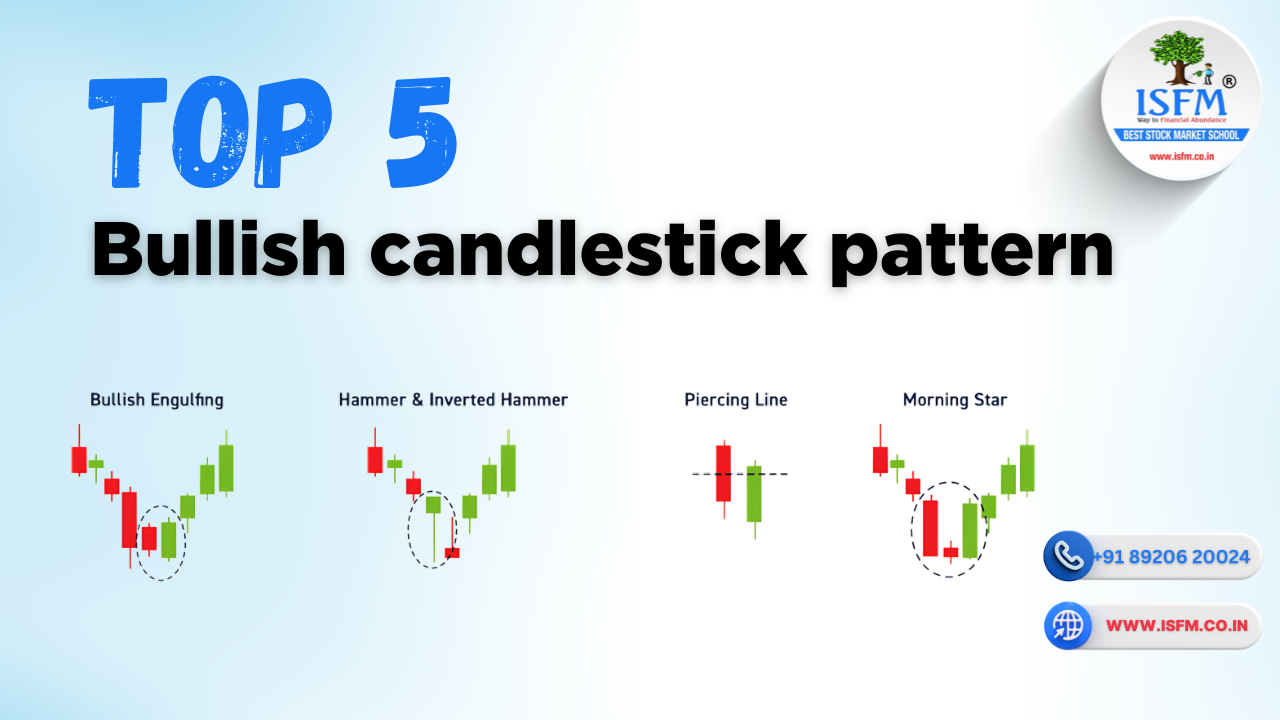
Candlestick patterns are the heartbeat of price action trading. If you want to spot trend reversals, early buying signals, or momentum breakouts, you need to master a few key bullish candlestick patterns.
In this blog, we’ll explore the Top 5 Bullish Candlestick Patterns, including their:
- Relevance in real-time trading
- Entry confirmation techniques
- Risk management using stop loss
- Common failure signals
- Special points every trader must remember
- And how to master these inside ISFM’s professional trading courses
1. Bullish Engulfing Pattern
What It Is:
A two-candle bullish reversal pattern where the second green candle fully engulfs the previous red candle’s body. It appears after a downtrend, signaling that buyers have taken control.
Relevance:
- Signals strong shift in momentum
- One of the most trusted reversal setups
- Useful for swing traders and intraday traders
Confirmation:
- Enter after next candle breaks above the green engulfing candle’s high
- Confirm with volume surge or RSI divergence
Failure Signs:
- Appears in sideways markets
- No confirmation candle
- Forms on low volume
Stop Loss:
- Below the low of the engulfing candle
Special Note:
- Strongest when formed at key support levels
- Avoid trading against higher time frame trends
2. Morning Star PatternWhat It Is:
A three-candle bullish reversal pattern appearing after a downtrend:
- Large red candle
- Small indecision candle (Doji/Spinning Top)
- Large green candle closing above midpoint of Candle 1
Relevance:
- Indicates trend exhaustion and reversal
- Common at the end of sharp sell-offs
Confirmation:
- Enter when the third candle closes strongly above the Doji
- Additional strength if volume rises
Failure Signs:
- Third candle is weak or lacks volume
- Pattern forms during news or low liquidity
Stop Loss:
- Below the low of the middle candle
Special Note:
- Combine with support zones, moving averages, or RSI oversold
3. Hammer Candlestick Pattern
What It Is:
A single candle with a small real body on top and a long lower shadow, appearing after a downtrend. It suggests rejection of lower prices and potential reversal.
Relevance:
- Simple and effective signal
- Works well in volatile markets and swing entries
Confirmation:
- Enter on next candle closing above hammer’s high
- Extra confidence with volume confirmation
Failure Signs:
- Appears in range-bound conditions
- No follow-up bullish candle
Stop Loss:
- Below the low of the hammer
Special Note:
- Avoid trading hammers with upper wicks
- Ideal when paired with trendline support
4. Piercing Line Pattern
What It Is:
A two-candle reversal pattern:
- First candle is bearish
- Second is bullish and closes more than halfway into the first candle’s body
Relevance:
- Signals buyers are reclaiming momentum
- Useful in short-term pullbacks
Confirmation:
- Enter after second candle closes above 50% of red candle
- Confirm with volume rise or bullish MACD crossover
Failure Signs:
- Forms on thinly traded stocks
- Weak second candle body
Stop Loss:
- Below the low of the first red candle
Special Note:
- Avoid in low-volume sideways markets
- Combine with Fibonacci retracement or EMA bounce
5. Three White Soldiers
What It Is:
A three-candle bullish continuation or reversal pattern, featuring:
- Three long green candles
- Each closes higher than the previous
- All candles open within the prior candle’s body
Relevance:
- Strong momentum signal
- Indicates trend confirmation or reversal strength
Confirmation:
- Confirm with volume and breaking resistance levels
Failure Signs:
- Appears during overbought conditions
- Fourth candle shows bearish rejection
Stop Loss:
- Below the low of the first candle or support zone
Special Note:
- Watch for volume divergence or wicks on 3rd candle
- Avoid entries into nearby resistance zones
Learn to Master Candlestick Trading at ISFM
At ISFM – International School of Financial Market, we train students to recognize, confirm, and trade bullish candlestick patterns with:
- Price action
- Trendline support
- Indicator confluence (RSI, MACD, Volume)
- Real-time execution and money management
Recommended Courses:
🔸 Technical Analysis Course
🔸 Chartered Stock Trading Expert – CSTX Course
🔸 Full Stock Trading Programs (Online + Offline)
✅ One-on-One Mentorship
✅ Free Study Materials & Live Market Practice
✅ 100% Placement Support
✅ SEBI/NISM Certification Guidance
📞 Call: +91 8882000233 | +91 8168573253
📍 Location: Sector-38, Gurgaon
🌐 Visit: www.isfm.co.in
Conclusion
These Top 5 Bullish Candlestick Patterns are essential for any trader serious about market timing and price action. From reversal setups like Bullish Engulfing to strong continuation patterns like Three White Soldiers, each of these candles can give you a technical edge—when used with confirmation and proper risk control.