
Triangle breakouts are among the most powerful chart patterns used by professional traders in the Indian stock market. These setups often signal explosive Nifty moves before they become obvious to retail participants.
An ascending triangle shows rising buying pressure, while a descending triangle reflects increasing selling pressure. When combined with strong volume confirmation, these patterns can create high-probability trading opportunities with attractive risk-reward ratios.
In Nifty 50 trading, triangle patterns become even more reliable because institutional activity and high liquidity help validate genuine breakouts.
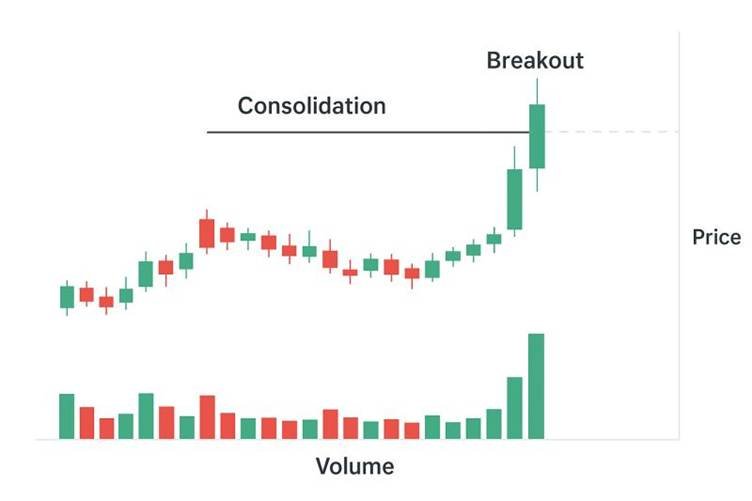
What Is an Ascending Triangle?
An ascending triangle is a bullish continuation pattern formed when:
- Resistance remains flat
- Price creates higher lows
- Buying pressure gradually increases
This structure signals that buyers are becoming more aggressive while sellers struggle to push prices lower.
Key Confirmation Signals
- Minimum two resistance touches
- Multiple rising lows
- Contracting volatility
- Volume expansion during breakout
Real Nifty Example
During the March 2025 rally, Nifty traded between 22,000 and 22,500 while continuously forming higher lows. Once the index closed above 22,500 with strong volume, momentum accelerated sharply toward 23,200.
Disciplined traders captured nearly 700 points from the breakout move.
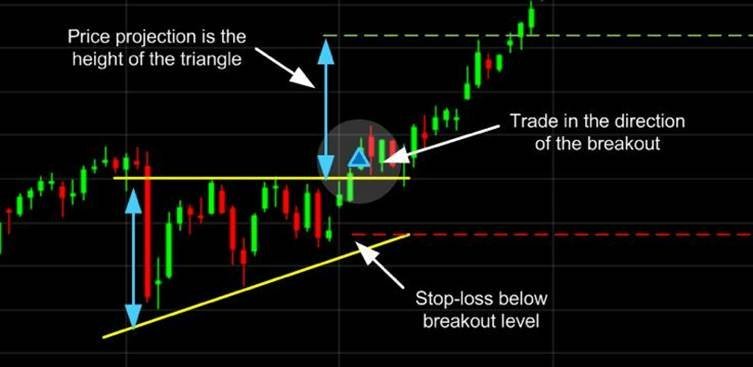
Profit Target Formula
text{Breakout Target} = text{Breakout Level} + text{Pattern Height}
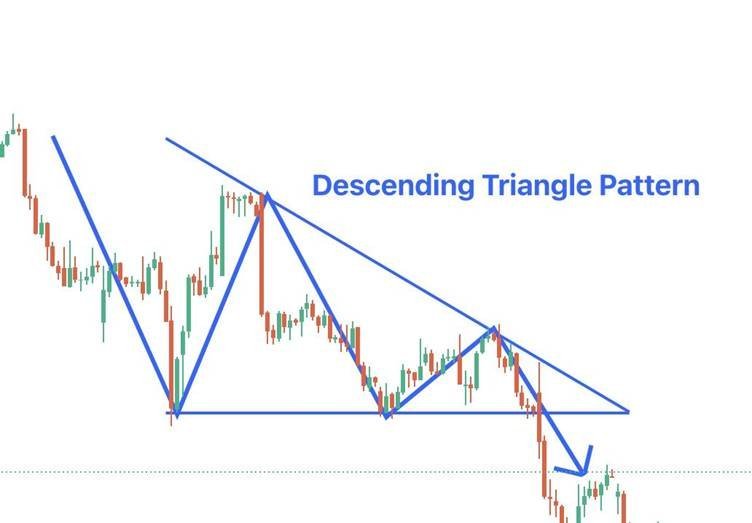
Understanding the Descending Triangle
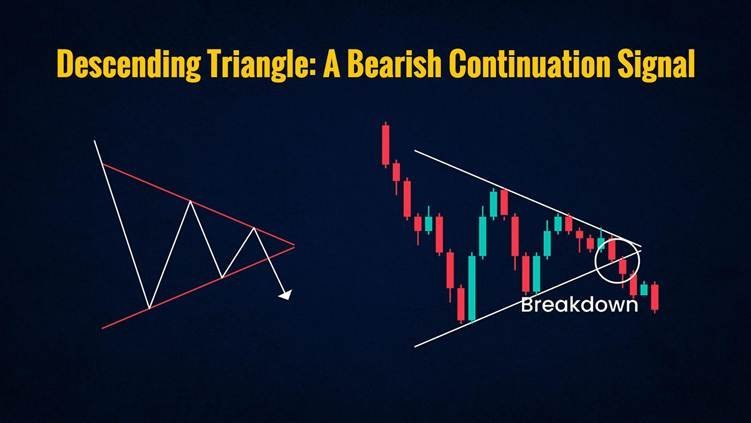
The descending triangle is a bearish continuation pattern that reflects increasing selling pressure in the market.
In this setup:
- Support remains flat
- Lower highs continue forming
- Sellers become increasingly aggressive
As price compresses toward support, traders prepare for a potential downside breakdown.
Key Signals
- Flat support zone
- Falling resistance trendline
- Weakening rebounds
- High volume during breakdown
Real Nifty Example
During the July 2025 correction, Nifty repeatedly defended the 21,800 support zone. However, every rebound became weaker as sellers continued pushing resistance lower.
Once Nifty closed below 21,800 with heavy volume, bearish momentum accelerated toward 21,200.
This created nearly 600 points of downside opportunity for prepared traders.
Downside Target Formula
Breakdown Target} = {Breakdown Level} – {Pattern Height}
5-Step Nifty Triangle Breakout Trading System
1. Identify the Structure
Look for clean triangle formations with repeated trendline reactions. TradingView scanners can help identify setups quickly.
2. Wait for Confirmation
Never enter before breakout confirmation.
The ideal breakout candle should:
- Close beyond resistance/support
- Show strong momentum
- Have volume above average
3. Plan Entry Carefully
Many traders prefer entering:
- Around 1% above bullish breakouts
- Around 1% below bearish breakdowns
This helps reduce false breakout traps.
4. Place Logical Stop Loss
Stop losses should remain near the opposite trendline to control risk during sudden reversals.
5. Measure the Target
Project the height of the triangle from the breakout zone to estimate the target.
Risk Management: The Real Edge
Even the best chart patterns can fail during unexpected events.
Professional traders focus heavily on:
- Position sizing
- Capital protection
- Controlled execution
- Emotional discipline
Most Popular Risk Rule
text{Maximum Risk Per Trade} = 1% text{ of Total Capital}
Historical backtesting of Nifty triangle breakout setups often shows strong win rates when traders follow strict confirmation and stop-loss rules.
Traders wanting to improve practical market skills can also explore ISFM’s Technical Analysis Course and Advance Derivatives Training.
Final Conclusion
Triangle breakouts remain one of the most effective price action setups in Nifty trading because they combine:
- Trend strength
- Institutional participation
- Clear risk levels
- Strong momentum potential
The key is not predicting every move correctly. The real advantage comes from disciplined execution, proper confirmation, and consistent risk management.
Start tracking Nifty triangle formations weekly, practice through paper trading, and focus on process over excitement. Your next profitable breakout opportunity may already be forming on the charts.
FAQs
1. Are triangle breakouts reliable in Nifty trading?
Yes, especially when supported by strong volume and proper confirmation candles.
2. Which triangle pattern is bullish?
The ascending triangle is generally considered a bullish continuation pattern.
3. What is the biggest mistake traders make?
Entering before breakout confirmation and ignoring stop losses.
4. Can beginners trade triangle patterns?
Yes, but beginners should first practice through paper trading and focus on risk management.
Disclosure & Disclaimer
This article is for educational purposes only and should not be considered financial or investment advice. Trading in stock markets involves risk. Please consult a financial advisor before making investment decisions.
If you found this blog helpful, You might also like: What separates a profitable trader from a losing trader?