What is Fair Value Gap (FVG): The Trading Concept Every Advanced Trader Should Know
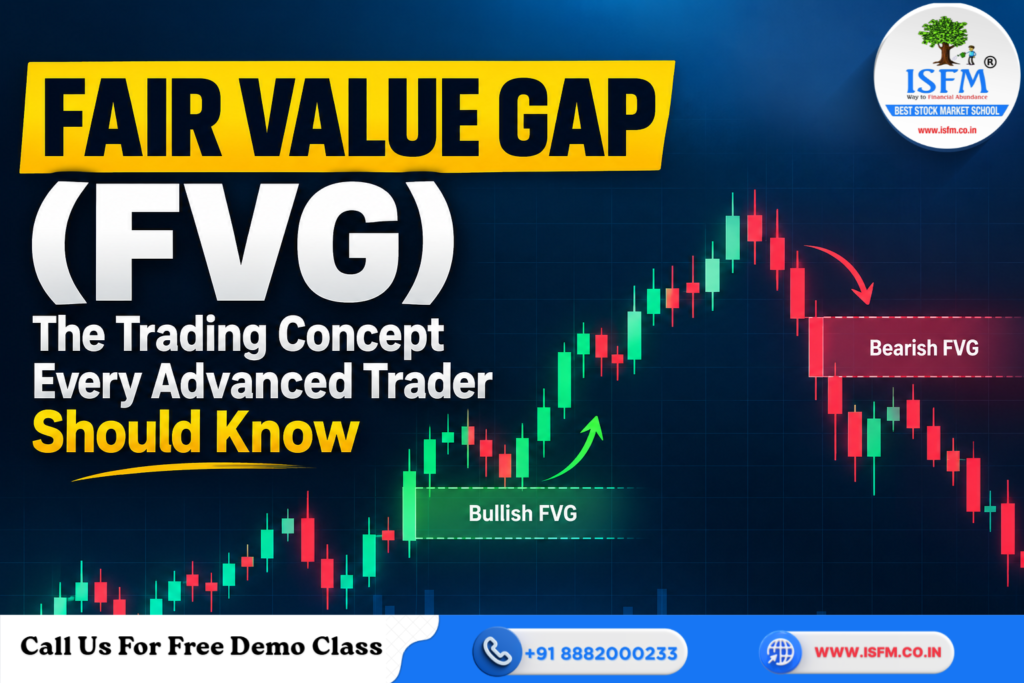
Imagine a stock trading near ₹500. Suddenly, a strong bullish candle pushes the price towards ₹520. The next candle continues higher, leaving a visible area between the first candle’s high and the third candle’s low. Why do traders pay attention to that unfilled area? This pattern is known as a Fair Value Gap (FVG). It is widely discussed in Smart Money Concepts (SMC) and advanced price action trading. Traders use it to identify potential price imbalances and areas where the market might react when price returns. However, an FVG is not a guaranteed reversal or continuation signal. According to Sushil Alewa, SEBI Registered Research Analyst (INH100009433), understanding price action requires more than recognising chart patterns. Traders should also evaluate market structure, momentum, and risk before making decisions. Developing these skills through a structured technical analysis course in Gurgaon can help learners build a stronger foundation for interpreting price movements. What Is a Fair Value Gap? A Fair Value Gap is a three-candle price-action pattern that forms when a strong directional move creates a non-overlapping area between the first and third candles. The middle candle typically shows strong momentum, while the surrounding candles help define the imbalance zone. Traders interpret this area as a potential rebalancing zone where price may revisit. An FVG differs from a traditional market gap between two trading sessions. It develops within a three-candle sequence and does not prove that institutional traders placed orders at a particular price. Bullish Fair Value Gap A bullish FVG forms during a strong upward move. The middle candle shows bullish displacement, and price continues rising. Candle 1 establishes the initial range, Candle 2 drives price higher, and Candle 3 continues the move. A bullish FVG exists when the low of Candle 3 is above the high of Candle 1. The space between these two prices becomes the bullish FVG zone. For example, if the first candle’s high is ₹505 and the third candle’s low is ₹510, the bullish FVG lies between ₹505 and ₹510. If the stock later pulls back into this zone, traders may watch for bullish rejection or renewed buying pressure. Bearish Fair Value Gap A bearish FVG forms when strong selling pushes price downward. The middle candle displays bearish displacement, followed by continued weakness. The defining condition is that the high of Candle 3 is below the low of Candle 1. The area between these prices represents the bearish FVG. For example, if the first candle’s low is ₹1,000 and the third candle’s high is ₹990, the bearish FVG lies between ₹990 and ₹1,000. If price subsequently rallies into this zone, traders may look for bearish rejection or signs that the downtrend is resuming. The reaction must be assessed rather than assumed. Why Displacement Matters? Not every three-candle sequence produces a meaningful FVG. Displacement refers to a strong, decisive price move that often appears through a relatively large candle and limited overlap with surrounding price action. Displacement may accompany strong buying or selling pressure, a break of short-term market structure, or a shift in momentum. An FVG created alongside a clear structure break may attract more attention than a tiny imbalance formed during sideways trading. Still, candle size alone cannot confirm the strength or intentions of market participants. Traders developing broader chart-reading skills can explore ISFM’s Chartered Stock Trading Expert Course to learn about advanced trading concepts and market analysis. How Traders Mark and Use an FVG? Traders first identify a strong directional move, locate the three-candle pattern, and mark the zone between Candle 1 and Candle 3. They then observe how price behaves if it revisits that area. Many traders also monitor the 50% midpoint, commonly called consequent encroachment. For an FVG spanning ₹505 to ₹515, the midpoint is ₹510. Some traders watch this level for a reaction, although price can reverse before reaching it or move completely through the zone. In an uptrend, a trader might wait for price to revisit a bullish FVG and seek confirmation through a bullish candle or a lower-timeframe structure shift. In a downtrend, the same approach can be applied to a bearish FVG. Before entering, traders should define an invalidation level, calculate position size, and establish acceptable risk. In Nifty or Bank Nifty futures and options, rapid movements, volatility changes, and execution costs can significantly affect results. Traders interested in building a broader understanding of derivatives can explore ISFM’s stock market investment courses for relevant learning options. FVG vs Order Block Feature Fair Value Gap Order Block Meaning Price imbalance during a fast move Potential prior buying or selling interest Formation Three-candle pattern with a non-overlapping gap Often the last opposite-coloured candle before displacement Main use Potential rebalancing or reaction zone Potential support or resistance zone Confirmation Displacement and market structure Displacement and market-structure break Traders may combine both concepts when their zones overlap. However, neither guarantees that price will react as expected. Understanding technical analysis alongside these concepts can help traders place individual patterns within a broader market context. FVG vs Normal Market Gap A normal gap generally occurs between one session’s closing price and the next session’s opening price. An FVG, in contrast, forms within a three-candle sequence and can appear during an ongoing session. A normal gap may remain open for several sessions, while an FVG may be revisited within minutes, hours, or days. Neither type of gap must necessarily be filled. Filled, Partially Filled and Inverse FVG An unfilled FVG has not yet been revisited by price. A partially filled FVG has been entered but not completely traversed. A fully filled FVG has been traded through its entire price range. An inverse FVG refers to a previously identified imbalance that may change its potential role after price breaks through it. Depending on the trading framework, a former resistance zone might become a potential support zone, or vice versa. These interpretations vary across trading communities. Common FVG Trading Mistakes Common mistakes include marking every small pattern as an FVG, ignoring higher-timeframe trends, entering without confirmation, and