
April 29, 2025

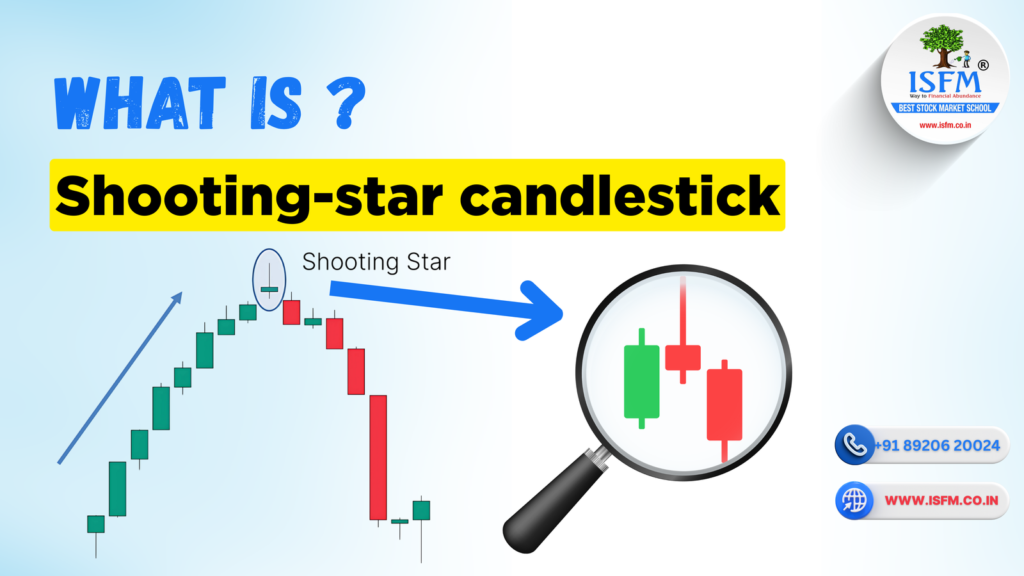
What is Shooting start candlestick pattern
Blog

Shooting Star Candlestick Pattern: Spotting Bearish Reversals Before They Drop

In technical analysis, timing is everything. Knowing when a bullish trend is losing steam can save you from losses and even help you profit. The Shooting Star candlestick pattern is one of the clearest early-warning signs of a bearish reversal. This guide will walk you through: What is a Shooting Star Candlestick? The Shooting Star is a single-candle bearish reversal pattern that appears after an uptrend. It has a small real body, little to no lower shadow, and a long upper wick, showing that buyers failed to hold higher prices. Key Features: Think of it like a star shooting up… and quickly falling back—exactly what happens to price How the Shooting Star Forms? How to Identify a Shooting Star? To qualify as a valid Shooting Star: ✅ It must form after an uptrend✅ The upper wick is long (typically 2x the body)✅ The real body is small and near the low of the candle✅ Ideally, there’s little or no lower shadow✅ Confirmation from the next candle closing lower increases accuracy How to Trade the Shooting Star Pattern? Entry Strategy: Stop Loss: Target: Pros and Cons of the Shooting Star Pattern Pros: Cons: Master Shooting Star & Candlestick Trading at ISFM At ISFM – International School of Financial Market, we teach how to trade candlestick patterns in real markets using price action, confluence, volume analysis, and risk management. Our Most Popular Courses: 🔹 Technical Analysis Course (Gurgaon & Online)🔹 CSTX – Chartered Stock Trading Expert Program🔹 Stock Market Courses – Beginner to Advanced ✅ Live Market Training + Recorded Classes✅ Free Study Material + Strategy PDFs✅ 100% Placement Assistance✅ SEBI/NISM Certification Guidance 📞 Call Now: +91 8882000233 | +91 8168573253📍 Offline in Gurgaon | Online across India🌐 Visit: www.isfm.co.in Conclusion The Shooting Star candlestick pattern is a powerful tool for spotting potential market tops and preparing for reversals. It gives traders an early exit signal or a low-risk shorting opportunity. 🚀 Want to learn how to trade Shooting Star, Doji, Engulfing, and more with confidence? Join ISFM – India’s Best Stock Market School and master the market with expert mentors.
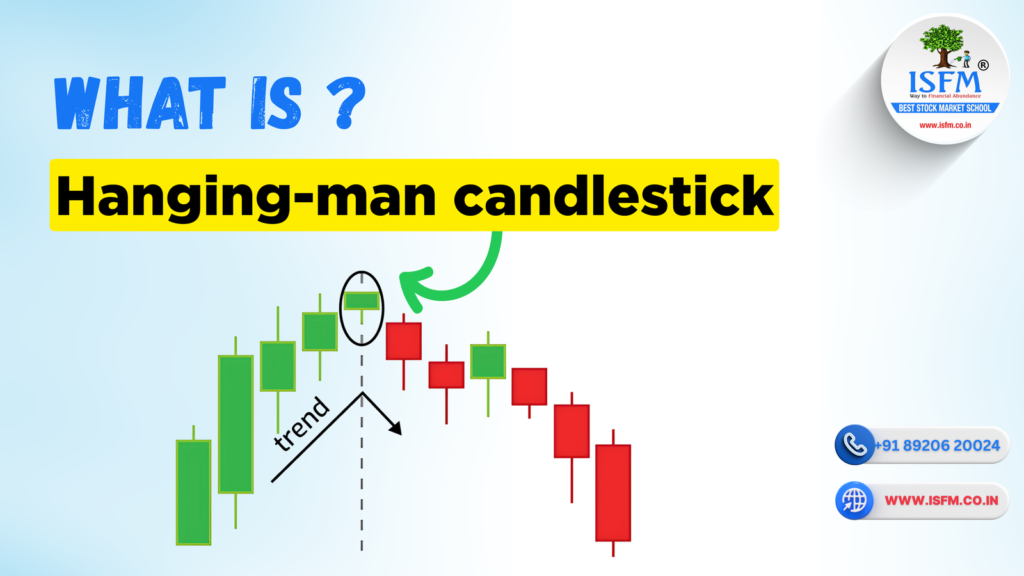

B-638 What is Hanging man candlestick pattern_WWW.ISFM.CO.IN
Blog

Hanging Man Candlestick Pattern: A Warning Sign for Traders

In the world of technical analysis, candlestick patterns help traders make informed decisions by revealing market psychology. One of the most reliable bearish reversal indicators at the top of an uptrend is the Hanging Man candlestick pattern. If you’re trading in an overbought market or suspect a trend is losing steam, spotting a Hanging Man can save you from major losses—or even help you profit from reversals. In this blog, we’ll cover: What is a Hanging Man Candlestick? The Hanging Man is a single-candle bearish reversal pattern that appears after a strong uptrend. It looks just like a Hammer but appears at the top, not the bottom. Key Characteristics: It reflects weakening buyer strength and the possible entry of sellers. How Does the Hanging Man Form? It’s a sign that sellers are testing the waters—and bulls are starting to tire. How to Identify a Hanging Man? Use the following checklist to spot a true Hanging Man: ✅ Appears after a noticeable uptrend✅ Small real body at the top of the range✅ Long lower shadow (at least twice the body)✅ Little or no upper wick✅ Ideally confirmed with next bearish candle or high volume Learn how to read patterns like this inside our Technical Analysis Course. How to Trade the Hanging Man Pattern? Entry Strategy: Stop Loss: Target: We cover this trading logic live in our CSTX – Chartered Stock Trading Expert Course Pros and Cons of Hanging Man Pattern Pros: Cons: Master Candlestick Trading with ISFM To become a consistently profitable trader, you need more than just theory—you need practical, live experience with candlestick setups like Hanging Man, Doji, Shooting Star, and more. 🔗 Our Best Courses for This: 📘 Technical Analysis Course – Online/Offline📘 Chartered Stock Trading Expert (CSTX)📘 Stock Trading Courses for Beginners & Professionals ✅ One-on-One Mentorship✅ NISM Certification Guidance✅ Free Study Material & Backup Recordings✅ 100% Placement Assistance 📍 Sector-38, Medicity Road, Gurgaon📞 Call Now: +91 8882000233 | +91 8168573253🌐 Visit: www.isfm.co.in Conclusion The Hanging Man is a simple yet powerful candlestick pattern that signals trend exhaustion and possible reversal. When used in the right context, it can help you exit long trades early or prepare for short entries with low risk. 🚀 Want to learn candlestick patterns in live markets? Join ISFM – India’s Best Stock Market School and turn your trading passion into profit!

Scroll to Top